Baltimore metropolitan area
Central Maryland Baltimore-Columbia-Towson Metropolitan Area | |
|---|---|

Baltimore's Inner Harbor in August 2010
| |
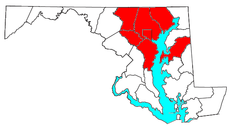 Counties of the Baltimore-Columbia-Towson metropolitan area highlighted in red
| |
| Country | United States |
| State | Maryland |
| Principal municipalities | Baltimore, Columbia, Towson |
| Population
(2020)
| |
| • Metropolitan area | 2,844,510 (20th) |
| • Urban | (19th) |
| • Urban density | 1,038.9/sq mi (401.1/km2) |
| • CSA | 9,973,383 (3rd) |
| MSA = 2020, CSA = 2020, Urban & Densities = 2010 |
|
| GDP | |
| • MSA | $241.4 billion (2022) |
| Time zone | UTC−5 (ET) |
| • Summer (DST) | UTC−4 (EST) |
The Baltimore–Columbia–Towson Metropolitan Statistical Area, also known as Central Maryland, is a metropolitan statistical area (MSA) in Maryland as defined by the United States Office of Management and Budget (OMB). It is part of the larger Washington–Baltimore combined statistical area. As of 2022, the combined population of the seven counties is 2,985,871, making it the 20th-largest metropolitan statistical area in the nation.
The area has the fourth-highest median household income in the United States, at $66,970 as of 2012.
Composition
The area includes the following counties:
- Anne Arundel County
- Baltimore City
- Baltimore County
- Carroll County
- Harford County
- Howard County
- Queen Anne's County
| County | 2021 Estimate | 2020 Census | Change | Area | Density |
|---|---|---|---|---|---|
| Baltimore County | 849,316 | 854,535 | −0.61% | 598.30 sq mi (1,549.6 km2) | 1,420/sq mi (548/km2) |
| Anne Arundel County | 590,336 | 588,261 | +0.35% | 414.90 sq mi (1,074.6 km2) | 1,423/sq mi (549/km2) |
| Baltimore City | 576,498 | 585,708 | −1.57% | 80.94 sq mi (209.6 km2) | 7,123/sq mi (2,750/km2) |
| Howard County | 334,529 | 332,317 | +0.67% | 250.74 sq mi (649.4 km2) | 1,334/sq mi (515/km2) |
| Harford County | 262,977 | 260,924 | +0.79% | 437.09 sq mi (1,132.1 km2) | 602/sq mi (232/km2) |
| Carroll County | 173,873 | 172,891 | +0.57% | 447.59 sq mi (1,159.3 km2) | 388/sq mi (150/km2) |
| Queen Anne's County | 50,798 | 49,874 | +1.85% | 371.91 sq mi (963.2 km2) | 137/sq mi (53/km2) |
| Total | 2,838,327 | 2,844,510 | −0.22% | 2,601.47 sq mi (6,737.8 km2) | 1,091/sq mi (421/km2) |
| Census | Pop. | Note | %± |
|---|---|---|---|
| 1820 | 96,201 | — | |
| 1830 | 120,870 | 25.6% | |
| 1840 | 134,379 | 11.2% | |
| 1850 | 210,646 | 56.8% | |
| 1860 | 266,553 | 26.5% | |
| 1870 | 330,741 | 24.1% | |
| 1880 | 415,649 | 25.7% | |
| 1890 | 507,348 | 22.1% | |
| 1900 | 639,332 | 26.0% | |
| 1910 | 720,387 | 12.7% | |
| 1920 | 852,051 | 18.3% | |
| 1930 | 984,606 | 15.6% | |
| 1940 | 1,083,300 | 10.0% | |
| 1950 | 1,337,373 | 23.5% | |
| 1960 | 1,820,314 | 36.1% | |
| 1970 | 2,089,092 | 14.8% | |
| 1980 | 2,199,531 | 5.3% | |
| 1990 | 2,382,172 | 8.3% | |
| 2000 | 2,552,994 | 7.2% | |
| 2010 | 2,710,489 | 6.2% | |
| 2020 | 2,844,510 | 4.9% | |
| 2022 (est.) | 2,835,672 | −0.3% | |
| U.S. Decennial Census 1790–1960 1900–1990 1990–2000 | |||
Principal communities
The metropolitan area includes the following principal communities:
It also includes several other communities (not necessarily incorporated as cities or towns):
- Aberdeen
- Annapolis
- Bel Air
- Catonsville
- Dundalk
- Eldersburg
- Ellicott City
- Edgewood
- Glen Burnie
- Hanover
- Havre de Grace
- Jessup
- Joppatowne
- Owings Mills
- Westminster
In addition to its technical metropolitan area, Baltimore also receives a large number of commuters from cities such as York, Pennsylvania and the Washington Metropolitan Area.
History
Companies in metropolitan Baltimore
Four Fortune 1000 companies are headquartered in Greater Baltimore: Grace Chemicals in Columbia and Legg Mason, T. Rowe Price, and McCormick & Company in Hunt Valley.
Other companies headquartered in Greater Baltimore include AAI Corporation and Sinclair Broadcast Group in Hunt Valley and Adams Express Company, Brown Advisory, Alex Brown, First Home Mortgage Corporation, FTI Consulting, Petroleum & Resources Corporation, Prometric, Sylvan Learning, Laureate Education, Under Armour, DAP, DeBaufre Bakeries, Wm. T. Burnett & Co, Old Mutual Financial Network, Fila USA, and Firaxis Games in Sparks.
Government and infrastructure
The capital of Maryland and the agencies of the Maryland state government are located in the Baltimore MSA, mainly in Annapolis and Baltimore City. The area is also home to the National Security Agency (NSA) headquarters in Fort Meade in Anne Arundel County, as well as the Social Security Administration and the Centers for Medicare & Medicaid Services (CMS) in Woodlawn in Baltimore County.
| Year | DEM | GOP | Others |
|---|---|---|---|
| 2020 | 61.7% 878,185 | 35.7% 507,676 | 2.7% 38,014 |
| 2016 | 55.8% 733,718 | 37.9% 497,637 | 6.3% 83,046 |
| 2012 | 57.8% 746,052 | 39.8% 513,164 | 2.4% 31,212 |
| 2008 | 57.4% 725,858 | 40.7% 513,811 | 1.9% 24,189 |
| 2004 | 52.2% 602,806 | 46.5% 536,565 | 1.3% 15,019 |
| 2000 | 53.9% 529,648 | 42.6% 418,775 | 3.4% 33,713 |
| 1996 | 52.0% 449,711 | 39.8% 344,488 | 8.2% 71,112 |
| 1992 | 48.8% 489,922 | 35.8% 359,098 | 15.4% 154,849 |
| 1988 | 48.2% 417,858 | 51.1% 443,183 | 0.7% 6,268 |
Sports teams in metropolitan Baltimore
- Baltimore Orioles of Major League Baseball (since 1954)
- Baltimore Ravens of National Football League (since 1996)
- Baltimore Burn of Women's Spring Football League (since 2001)
- Baltimore Nighthawks of the Independent Women's Football League (since 2008)
- Charm City Roller Girls of the Women's Flat Track Derby Association (since 2006)
- Coppin State Eagles
- Johns Hopkins Blue Jays competes in Division I for men's and women's lacrosse only
- Loyola Greyhounds
- Morgan State Bears
In Baltimore County:
- Towson Tigers in Towson
- UMBC Retrievers in Catonsville
- Baltimore Blast of the Major Arena Soccer League (since 2014)
- Navy Midshipmen in Annapolis
- Chesapeake Bayhawks in Annapolis
- Maryland Black Bears in Odenton