World economy

The world economy or global economy is the economy of all humans in the world, referring to the global economic system, which includes all economic activities conducted both within and between nations, including production, consumption, economic management, work in general, exchange of financial values and trade of goods and services. In some contexts, the two terms are distinct: the "international" or "global economy" is measured separately and distinguished from national economies, while the "world economy" is simply an aggregate of the separate countries' measurements. Beyond the minimum standard concerning value in production, use and exchange, the definitions, representations, models and valuations of the world economy vary widely. It is inseparable from the geography and ecology of planet Earth.
It is common to limit questions of the world economy exclusively to human economic activity, and the world economy is typically judged in monetary terms, even in cases in which there is no efficient market to help valuate certain goods or services, or in cases in which a lack of independent research, genuine data or government cooperation makes calculating figures difficult. Typical examples are illegal drugs and other black market goods, which by any standard are a part of the world economy, but for which there is, by definition, no legal market of any kind.
However, even in cases in which there is a clear and efficient market to establish monetary value, economists do not typically use the current or official exchange rate to translate the monetary units of this market into a single unit for the world economy since exchange rates typically do not closely reflect worldwide value – for example, in cases where the volume or price of transactions is closely regulated by the government.
Rather, market valuations in a local currency are typically translated to a single monetary unit using the idea of purchasing power. This is the method used below, which is used for estimating worldwide economic activity in terms of real United States dollars or euros. However, the world economy can be evaluated and expressed in many more ways. It is unclear, for example, how many of the world's 7.8 billion people (as of March 2020) have most of their economic activity reflected in these valuations.
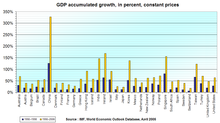
According to Maddison, until the middle of the 19th century, global output was dominated by China and India. Waves of the Industrial Revolution in Western Europe and Northern America shifted the shares to the Western Hemisphere. As of 2023, the following 19 countries or collectives have reached an economy of at least US$2 trillion by GDP in nominal or PPP terms: Brazil, Canada, China, France, Germany, India, Indonesia, Italy, Japan, Mexico, South Korea, Russia, Saudi Arabia, Spain, Turkey, the United Kingdom, the United States, the European Union and the African Union.
Despite high levels of government investment, the global economy decreased by 3.4% in 2020 in the midst of the COVID-19 pandemic, an improvement from the World Bank's initial prediction of a 5.2 percent decrease. Cities account for 80% of global GDP, thus they faced the brunt of this decline. The world economy increased again in 2021 with an estimated 5.5 percent rebound.
Overview
World economy by country groups
| Country group |
List of country groups by GDP (nominal) in 2023 (or at peaked level) |
List of country groups by GDP (PPP) in 2023 (or at peaked level) |
Number of countries |
Major economies | ||
|---|---|---|---|---|---|---|
| Value (in millions of US$) |
Share of Global GDP |
Value (in millions of US$) |
Share of Global GDP |
|||
|
Major advanced economies (G7) (Continents: Europe, North America and Asia) |
46,295,306 | 44.3% | 52,295,411 | 29.9% | 7 |
United States Japan Germany United Kingdom France Italy Canada |
|
Emerging and developing Asia (Continents: Asia and Oceania) |
25,441,042 | 24.4% | 58,503,987 | 33.5% | 30 |
China India Indonesia Thailand Bangladesh Vietnam Philippines Malaysia |
|
Other advanced economies (advanced economies excluding the G7) (Continents: Europe, Asia, Oceania and North America) |
14,634,255 | 14.0% | 19,624,991 | 11.2% | 34 |
South Korea Spain Australia Taiwan Netherlands Switzerland Belgium Singapore Ireland Sweden Norway Austria |
|
Latin America and the Caribbean (Continents: South America and North America) |
6,517,251 | 6.2% | 12,813,893 | 7.3% | 33 |
Brazil Mexico Argentina Colombia |
|
Emerging and developing Europe (Continents: Europe and Asia) |
4,933,179 | 4.7% | 12,926,223 | 7.4% | 15 |
Russia Turkey Poland Romania |
|
Middle East and Central Asia (Continents: Asia and Africa) |
4,698,168 (peaked at 4,750,874 in 2022) |
4.5% | 13,126,177 | 7.5% | 32 |
Saudi Arabia Egypt Iran Pakistan United Arab Emirates Kazakhstan Algeria |
|
Sub-Saharan Africa (Continent: Africa) |
1,957,231 (peaked at 2,013,032 in 2022) |
1.9% | 5,499,185 | 3.2% | 45 |
Nigeria South Africa |
| World | 104,476,432 | 100.0% | 174,789,867 | 100.0% | 196 | |
World economy by continent
| GDP sector composition (2019 estimate) | |||||||||||||||||||||||||||||||||
|
|||||||||||||||||||||||||||||||||
| The 25 largest economies by GDP (nominal), twenty largest economies by GDP (PPP) as of 2023. Members of the G-20 major economies are in bold. | |||||||||||||||||||||||||||||||||||||||||||||||||||||||||||||||||||||||||||||||||||||||||||||||||||||||||||||||||||||||||||||||||||||||||||||||||||||||||||||||||||||||||||||||||||||||||||||||||||||||||||||||||||||||||||||||||||||||||||||||||||||||||||||||||||||||||||||||||||||||||||||||||||||||||||||||||||||||||||||||||||||||||||||||||||||||||||||||||||||||||||||||||||||||||||||||||||||||||||||||||||||||||||||||||||||||||||||||||||||||||||||||||||
|---|---|---|---|---|---|---|---|---|---|---|---|---|---|---|---|---|---|---|---|---|---|---|---|---|---|---|---|---|---|---|---|---|---|---|---|---|---|---|---|---|---|---|---|---|---|---|---|---|---|---|---|---|---|---|---|---|---|---|---|---|---|---|---|---|---|---|---|---|---|---|---|---|---|---|---|---|---|---|---|---|---|---|---|---|---|---|---|---|---|---|---|---|---|---|---|---|---|---|---|---|---|---|---|---|---|---|---|---|---|---|---|---|---|---|---|---|---|---|---|---|---|---|---|---|---|---|---|---|---|---|---|---|---|---|---|---|---|---|---|---|---|---|---|---|---|---|---|---|---|---|---|---|---|---|---|---|---|---|---|---|---|---|---|---|---|---|---|---|---|---|---|---|---|---|---|---|---|---|---|---|---|---|---|---|---|---|---|---|---|---|---|---|---|---|---|---|---|---|---|---|---|---|---|---|---|---|---|---|---|---|---|---|---|---|---|---|---|---|---|---|---|---|---|---|---|---|---|---|---|---|---|---|---|---|---|---|---|---|---|---|---|---|---|---|---|---|---|---|---|---|---|---|---|---|---|---|---|---|---|---|---|---|---|---|---|---|---|---|---|---|---|---|---|---|---|---|---|---|---|---|---|---|---|---|---|---|---|---|---|---|---|---|---|---|---|---|---|---|---|---|---|---|---|---|---|---|---|---|---|---|---|---|---|---|---|---|---|---|---|---|---|---|---|---|---|---|---|---|---|---|---|---|---|---|---|---|---|---|---|---|---|---|---|---|---|---|---|---|---|---|---|---|---|---|---|---|---|---|---|---|---|---|---|---|---|---|---|---|---|---|---|---|---|---|---|---|---|---|---|---|---|---|---|---|---|---|---|---|---|---|---|---|---|---|---|---|---|---|---|---|---|---|---|---|---|---|---|---|---|---|---|---|---|---|---|---|---|---|---|---|---|---|---|---|---|---|---|---|---|---|---|---|---|---|---|---|---|---|---|---|---|---|---|---|---|---|---|---|---|---|---|
|
List of the 25 largest economies by GDP (nominal) at their peak level as of 2023 in million US$ |
List of the 25 largest economies by GDP (PPP) at their peak level as of 2023 in million Int$ |
List of the 26 economies by highest GDP (nominal) per capita at their peak level as of 2023 in US$ |
List of the 26 economies by highest GDP (PPP) per capita at their peak level as of 2023 in Int$' |
||||||||||||||||||||||||||||||||||||||||||||||||||||||||||||||||||||||||||||||||||||||||||||||||||||||||||||||||||||||||||||||||||||||||||||||||||||||||||||||||||||||||||||||||||||||||||||||||||||||||||||||||||||||||||||||||||||||||||||||||||||||||||||||||||||||||||||||||||||||||||||||||||||||||||||||||||||||||||||||||||||||||||||||||||||||||||||||||||||||||||||||||||||||||||||||||||||||||||||||||||||||||||||||||||||||||||||||||||||||||||||||||
|
|
|
|
||||||||||||||||||||||||||||||||||||||||||||||||||||||||||||||||||||||||||||||||||||||||||||||||||||||||||||||||||||||||||||||||||||||||||||||||||||||||||||||||||||||||||||||||||||||||||||||||||||||||||||||||||||||||||||||||||||||||||||||||||||||||||||||||||||||||||||||||||||||||||||||||||||||||||||||||||||||||||||||||||||||||||||||||||||||||||||||||||||||||||||||||||||||||||||||||||||||||||||||||||||||||||||||||||||||||||||||||||||||||||||||||
Twenty largest economies in the world by nominal GDP
Twenty largest economies in the world by GDP (PPP)
Statistical indicators
Finance

|
>$60,000
$50,000 – $60,000
$40,000 – $50,000
$30,000 – $40,000 |
$20,000 – $30,000
$10,000 – $20,000
$5,000 – $10,000
$2,500 – $5,000 |
$1,000 – $2,500
<$1,000
No data |

- GDP (GWP) (gross world product): (purchasing power parity exchange rates) – $59.38 trillion (2005 est.), $51.48 trillion (2004), $23 trillion (2002). The GWP is the combined gross national income of all the countries in the world. When calculating the GWP, add GDP of all countries. Also, GWP shows that imports and exports are equal. Because imports and exports balance exactly when considering the whole world:, this also equals the total global gross domestic product (GDP). According to the World Bank, the 2013 nominal GWP was approximately US$75.59 trillion. In 2017, according to the CIA's World Factbook, the GWP was around US$80.27 trillion in nominal terms and totaled approximately 127.8 trillion international dollars in terms of purchasing power parity (PPP). The per capita PPP GWP in 2017 was approximately Int$17,500 according to the World Factbook.
- GDP (GWP) (gross world product): (market exchange rates) – $60.69 trillion (2008). The market exchange rates increased from 1990 to 2008. The reason for this increase is the world's advancement in terms of technology.
- GDP (real growth rate): The following part shows the GDP growth rate and the expected value after one year.
- Developed Economies. A developed country, industrialized country, more developed country (MDC), or more economically developed country (MEDC), is a sovereign state that has a developed economy and advanced technological infrastructure relative to other less industrialized nations. Most commonly, the criteria for evaluating the degree of economic development are gross domestic product (GDP), gross national product (GNP), the per capita income, level of industrialization, amount of widespread infrastructure and general standard of living. Which criteria are to be used and which countries can be classified as being developed are subjects of debate. The GDP of the developed countries is predicted to fall from 2.2% in 2017 to 2.0% in 2018 due to the fall in dollar value.
- Developing Countries. A developing country is a country with a less developed industrial base (industries) and a low Human Development Index (HDI) relative to other countries. However, this definition is not universally agreed upon. There is also no clear agreement on which countries fit this category. A nation's GDP per capita, compared with other nations, can also be a reference point. In general, the United Nations accepts any country's claim of itself being "developing". The GDP of the developing countries is expected to rise from 4.3% in 2017 to 4.6% in 2018 due to political stability in those countries and advancement in technology.
- Least developed countries. The least developed countries (LDCs) is a list of developing countries that, according to the United Nations, exhibit the lowest indicators of socioeconomic development, with the lowest Human Development Index ratings of all countries in the world. The concept of LDCs originated in the late 1960s and the first group of LDCs was listed by the UN in its resolution 2768 (XXVI) of 18 November 1971. This is a group of countries that are expected to improve their GDP from 4.8% in 2017 to 5.4% in 2018. The predicted growth is associated advancement in technology and industrialization of those countries for the past decade.
- GDP – per capita: purchasing power parity – $9,300, €7,500 (2005 est.), $8,200, €6,800 (92) (2003), $7,900, €5,000 (2002)
- World median income: purchasing power parity $1,041, €950 (1993)
- GDP – composition by sector: agriculture: 4%; industry: 32%; services: 64% (2004 est.)
- Inflation rate (consumer prices); In economics, inflation is a general rise in the price level in an economy over a period of time, resulting in a sustained drop in the purchasing power of money. When the general price level rises, each unit of currency buys fewer goods and services; consequently, inflation reflects a reduction in the purchasing power per unit of money – a loss of real value in the medium of exchange and unit of account within the economy. The opposite of inflation is deflation, a sustained decrease in the general price level of goods and services. The common measure of inflation is the inflation rate, the annualized percentage change in a general price index, usually the consumer price index, over time. national inflation rates vary widely in individual cases, from declining prices in Japan to hyperinflation (In economics, hyperinflation is very high and typically accelerating inflation) in several Third World countries (2003):
- World 2.6% (2017), 2.8% (predicted 2018);
- Developed Economies 1% to 4% typically
- Developing Countries 5% to 60% typically
- Least developed countries 11.4% (2017), 8.3% (predicted 2018)
- Derivatives OTC outstanding notional amount: $601 trillion (Dec 2010) ([1])
- Derivatives exchange traded outstanding notional amount: $82 trillion (June 2011) ([2])
- Global debt issuance: $5.187 trillion, €3 trillion (2004), $4.938 trillion, €3.98 trillion (2003), $3.938 trillion (2002) (Thomson Financial League Tables)
- Global equity issuance: $505 billion, €450 billion (2004), $388 billion. €320 billion (2003), $319 billion, €250 trillion (2002) (Thomson Financial League Tables)
Employment


- Unemployment rate: 8.7% (2009 est.). 30% (2007 est.) combined unemployment and underemployment in many non-industrialized countries; developed countries typically 4%–12% unemployment.
Industries
- Industrial production growth rate: 3% (2002 est.)
Energy

- Yearly electricity – production: 21,080,878 GWh (2011 est.), 15,850,000 GWh (2003 est.), 14,850,000 GWh (2001 est.)
- Yearly electricity – consumption: 14,280,000 GWh (2003 est.), 13,930,000 GWh (2001 est.)
- Oil – production: 79,650,000 bbl/d (12,663,000 m3/d) (2003 est.), 75,460,000 barrels per day (11,997,000 m3/d) (2001)
- Oil – consumption: 80,100,000 bbl/d (12,730,000 m3/d) (2003 est.), 76,210,000 barrels per day (12,116,000 m3/d) (2001)
- Oil – proved reserves: 1.025 trillion barrel (163 km3 (39 cu mi) (2001 est.)
- Natural gas – production: 3,366 km3 (808 cu mi) (2012 est.), 2,569 km3 (616 cu mi) (2001 est.)
- Natural gas – consumption: 2,556 km3 (613 cu mi) (2001 est.)
- Natural gas – proved reserves: 161,200 km3 (38,700 cu mi) (1 January 2002)
Cross-border
- Yearly exports: $12.4 trillion, €11.05 trillion (2009 est.)
- Exports – commodities: the whole range of industrial and agricultural goods and services
- Exports – partners: US 12.7%, Germany 7.1%, China 6.2%, France 4.4%, Japan 4.2%, UK 4.1% (2008)
- Yearly imports: $12.29 trillion, €10.95 trillion (2009 est.)
- Imports – commodities: the whole range of industrial and agricultural goods and services
- Imports – partners: China 10.3%, Germany 8.6%, US 8.1%, Japan 5% (2008)
- Debt – external: $56.9 trillion, €40 trillion (31 December 2009 est.)
Gift economy
- Yearly economic aid – recipient: net Official Development Assistance (ODA) of $135.2 billion (2014)
Communications
Telephones – main lines in use: 843,923,500 (2007)
4,263,367,600 (2008)
- Telephones – mobile cellular: 3,300,000,000 (Nov. 2007)
- Internet Service Providers (ISPs): 10,350 (2000 est.)
- Internet users: 3,079,339,857 (31 December 2014 [3]), 360,985,492 (31 December 2000)
Transport
Transportation infrastructure worldwide includes:
-
Airports
- Total: 41,821 (2013)
-
Roadways
- Total: 32,345,165 km (20,098,354 mi)
- Paved: 19,403,061 km (12,056,503 mi)
- Unpaved: 12,942,104 km (8,041,851 mi) (2002)
-
Railways
- Total: 1,122,650 km (697,580 mi) includes about 190,000 to 195,000 km (118,000 to 121,000 mi) of electrified routes of which 147,760 km (91,810 mi) are in Europe, 24,509 km (15,229 mi) in the Far East, 11,050 km (6,870 mi) in Africa, 4,223 km (2,624 mi) in South America, and 4,160 km (2,580 mi) in North America.
Military
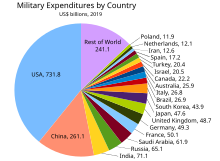
- World military expenditure in 2018: estimated to $1.822 trillion
- Military expenditures – percent of GDP: roughly 2% of gross world product (1999).
Science, research and development
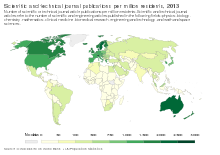
The Royal Society in a 2011 report stated that in terms of number of papers the share of English-language scientific research papers the United States was first followed by China, the UK, Germany, Japan, France, and Canada. In 2015, research and development constituted an average 2.2% of the global GDP according to the UNESCO Institute for Statistics. Metrics and rankings of innovation include the Bloomberg Innovation Index, the Global Innovation Index and the share of Nobel laureates per capita.
Resources and environment

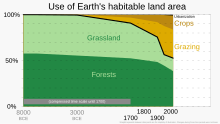
- Forests (carbon sinks, wood, ecosystem services, ...)
- Estimated number of trees that are net lost annually as of 2021: 10 billion
- Global annual deforested land in 2015–2020: 10 million hectares
- Global annual net forest area loss in 2000–2010 : 4.7 million hectares
- Other land degradation and land- and organisms-related ecosystem disturbances
- Soils (carbon sink, ecosystem services, food production, ...)
- Soil erosion by water in 2012: almost 36 billion tons (based on a high resolution global potential soil erosion model developed in 2017)
- Estimated annual loss of agricultural productivity due to soil erosion: 8 billion US dollars (based on the soil erosion data)
- Soil erosion by water in 2015: approximately 43 billion tons (according to a 2020 study)
-
Environmental impact of pesticides
- Pesticide use in tonnes of active ingredient in Australia in 2016: ca. 62,500 tonnes
- Soils (carbon sink, ecosystem services, food production, ...)
- Oceans (ecosystem services, food production, ...): Blue economy
- Waste and pollution (effects of economic mechanisms, effects on ecosystem services)
- As of 2018, about 380 million tonnes of plastic is produced worldwide each year. From the 1950s up to 2018, an estimated 6.3 billion tonnes of plastic has been produced worldwide, of which an estimated 9% has been recycled and another 12% has been incinerated with the rest reportedly being "dumped in landfills or the natural environment".
-
Air pollution
- Number of human deaths caused annually by air pollution worldwide: ca. 7 million
- Estimated global annual cost of air pollution: $5 trillion
-
Microplastic pollution
- Estimated accumulated number of microplastic particles in the North Atlantic Ocean in 2014: 15 to 51 trillion particles, weighing between 93,000 and 236,000 metric tons
- Estimated accumulated number of microplastic particles in the North Atlantic Ocean in 2020: 3700 microplastics per cubic meter
From the scientific perspective, economic activities are embedded in a web of dynamic, interrelated, and interdependent activities that constitute the natural system of Earth. Novel application of cybernetics in decision-making (such as in decision-making related to process- and product-design and related laws) and direction of human activity (such as economic activity) may make it easier to control modern ecological problems.
Historical development
| Estimations of world population and GDP from a 2020 research paper | |||
|---|---|---|---|
| Year | Population (million) |
GDP per capita ($1990 in PPP) |
GDP in billion ($1990 in PPP) |
| 1000000 BCE | 0.125 | 400 | 0.05 |
| 300000 BCE | 1 | 400 | 0.40 |
| 25000 BCE | 3.34 | 400 | 1.34 |
| 10000 BCE | 4 | 400 | 1.60 |
| 5000 BCE | 5 | 404 | 2.02 |
| 4000 BCE | 7 | 409 | 2.87 |
| 3000 BCE | 14 | 421 | 5.90 |
| 2000 BCE | 27 | 433 | 11.7 |
| 1000 BCE | 50 | 444 | 22.2 |
| 500 BCE | 100 | 457 | 45.7 |
| 200 BCE | 150 | 465 | 69.7 |
| 1 | 168 | 467 | 78.4 |
| 200 | 190 | 463 | 88.0 |
| 400 | 190 | 463 | 88.0 |
| 500 | 190 | 463 | 88.0 |
| 600 | 200 | 462 | 92.3 |
| 700 | 210 | 460 | 96.6 |
| 800 | 220 | 459 | 101 |
| 900 | 240 | 456 | 109 |
| 1000 | 265 | 453 | 120 |
| 1100 | 320 | 512 | 164 |
| 1200 | 360 | 551 | 198 |
| 1300 | 360 | 551 | 198 |
| 1400 | 350 | 541 | 190 |
| 1500 | 438 | 625 | 274 |
| 1600 | 556 | 629 | 350 |
| 1700 | 603 | 658 | 397 |
| 1820 | 1,042 | 712 | 741 |
| 1870 | 1,276 | 884 | 1,128 |
| 1900 | 1,563 | ||
| 1913 | 1,793 | 1,543 | 2,767 |
| 1920 | 1,863 | ||
| 1940 | 2,299 | 2,181 | 5,013 |
| 1950 | 2,528 | 2,104 | 5,318 |
| 1960 | 3,042 | 2,764 | 12,170 |
| 1970 | 3,691 | 3,725 | 13,751 |
| 1980 | 4,440 | 4,511 | 20,026 |
| 1990 | 5,269 | 5,149 | 27,133 |
| 2000 | 6,077 | 6,057 | 36,806 |
| 2010 | 6,873 | 7,814 | 53,704 |
| 2019 | 7,620 | 9,663 | 73,640 |
One example for a comparable metric other than GDP are the OECD Better Life Index rankings for different aggregative domains.
| Legend | |||
|---|---|---|---|
|
Explained by: Housing
Explained by: Income
Explained by: Jobs
|
Explained by: Community
Explained by: Education
Explained by: Environment
|
Explained by: Civic engagement
Explained by: Health
Explained by: Life Satisfaction
|
Explained by: Safety
Explained by: Work-Life Balance
|
| OECD Better Life Index rankings for 2016 | ||||||||||||
|---|---|---|---|---|---|---|---|---|---|---|---|---|
| Overall Rank |
Country | Housing | Income | Jobs | Community | Education | Environment | Civic engagement | Health | Life Satisfaction | Safety | Work-Life Balance |
| 1 | Norway |
|
|
|
|
|
|
|
|
|
|
|
| 2 | Australia |
|
|
|
|
|
|
|
|
|
|
|
| 3 | Denmark |
|
|
|
|
|
|
|
|
|
|
|
| 4 | Switzerland |
|
|
|
|
|
|
|
|
|
|
|
| 5 | Canada |
|
|
|
|
|
|
|
|
|
|
|
| 6 | Sweden |
|
|
|
|
|
|
|
|
|
|
|
| 7 | New Zealand |
|
|
|
|
|
|
|
|
|
|
|
| 8 | Finland |
|
|
|
|
|
|
|
|
|
|
|
| 9 | United States |
|
|
|
|
|
|
|
|
|
|
|
| 10 | Iceland |
|
|
|
|
|
|
|
|
|
|
|
| 11 | Netherlands |
|
|
|
|
|
|
|
|
|
|
|
| 12 | Germany |
|
|
|
|
|
|
|
|
|
|
|
| 13 | Luxembourg |
|
|
|
|
|
|
|
|
|
|
|
| 14 | Belgium |
|
|
|
|
|
|
|
|
|
|
|
| 15 | Austria |
|
|
|
|
|
|
|
|
|
|
|
| 16 | United Kingdom |
|
|
|
|
|
|
|
|
|
|
|
| 17 | Ireland |
|
|
|
|
|
|
|
|
|
|
|
| 18 | France |
|
|
|
|
|
|
|
|
|
|
|
| 19 | Spain |
|
|
|
|
|
|
|
|
|
|
|
| 20 | Slovenia |
|
|
|
|
|
|
|
|
|
|
|
| 21 | Czech Republic |
|
|
|
|
|
|
|
|
|
|
|
| 22 | Estonia |
|
|
|
|
|
|
|
|
|
|
|
| 23 | Japan |
|
|
|
|
|
|
|
|
|
|
|
| 24 | Slovakia |
|
|
|
|
|
|
|
|
|
|
|
| 25 | Italy |
|
|
|
|
|
|
|
|
|
|
|
| 26 | Israel |
|
|
|
|
|
|
|
|
|
|
|
| 27 | Poland |
|
|
|
|
|
|
|
|
|
|
|
| 28 | South Korea |
|
|
|
|
|
|
|
|
|
|
|
| 29 | Portugal |
|
|
|
|
|
|
|
|
|
|
|
| 30 | Latvia |
|
|
|
|
|
|
|
|
|
|
|
| 31 | Greece |
|
|
|
|
|
|
|
|
|
|
|
| 32 | Hungary |
|
|
|
|
|
|
|
|
|
|
|
| 33 | Russia |
|
|
|
|
|
|
|
|
|
|
|
| 34 | Chile |
|
|
|
|
|
|
|
|
|
|
|
| 35 | Brazil |
|
|
|
|
|
|
|
|
|
|
|
| 36 | Turkey |
|
|
|
|
|
|
|
|
|
|
|
| 37 | Mexico |
|
|
|
|
|
|
|
|
|
|
|
| 38 | South Africa |
|
|
|
|
|
|
|
|
|
|
|
The index includes 11 comparable "dimensions" of well-being:
- Housing: housing conditions and spendings (e.g. real estate pricing)
- Income: household income (after taxes and transfers) and net financial wealth
- Jobs: earnings, job security and unemployment
- Community: quality of social support network
- Education: education and what one gets out of it
- Environment: quality of environment (e.g. environmental health)
- Governance: involvement in democracy
- Health
- Life Satisfaction: level of happiness
- Safety: murder and assault rates
- Work-life balance
Economic studies
To promote exports, many government agencies publish on the web economic studies by sector and country. Among these agencies include the USCS (US DoC) and FAS (USDA) in the United States, the EDC and AAFC in Canada, Ubifrance in France, the UKTI in the United Kingdom, the HKTDC and JETRO in Asia, Austrade and the NZTE in Oceania. Through Partnership Agreements, the Federation of International Trade Associations publishes studies from several of these agencies (USCS, FAS, AAFC, UKTI, and HKTDC) as well as other non-governmental organizations on its website globaltrade.net.
See also
- Anarchy (international relations)
- Capitalism
- Common Wealth: Economics for a Crowded Planet (book)
- Economic bubble
- Economic collapse
- Fourth Industrial Revolution
- Global financial system
- Global workforce
- Globality
- Globalization
- International trade
- Trade route
- Overconsumption
- Petrodollar recycling
- World Trade Report
- World history
- World-systems theory
Regional economies:
Events:
Lists:
- List of countries by GDP sector composition
- List of world's largest economies (nominal) – based on current currency market exchange rates
- List of world's largest economies (PPP) – based on purchasing power parity
- Historical list of world's largest economies (PPP) – for the years between 1 and 1998