St. Patrick (provincial electoral district)
| Ontario electoral district | |
|---|---|
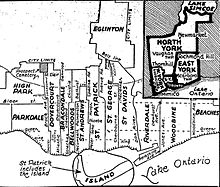
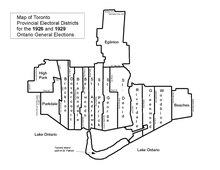 St. Patrick, in relation to the other Toronto ridings, after the 1926 redistribution.
| |
| Defunct provincial electoral district | |
| Legislature | Legislative Assembly of Ontario |
| District created | 1925 |
| District abolished | 1967 |
| First contested | 1926 |
| Last contested | 1963 |
St. Patrick was a provincial electoral district in Ontario, Canada, that was established in 1926 out of the district of Toronto Northeast. It lasted until 1967 when it was merged with St. Andrew to form St. Andrew—St. Patrick.
St. Patrick riding took its name from the former "St. Patrick's ward" of the City of Toronto.
Boundaries
It was created after a major riding redistribution in 1926. Its boundaries consisted of Spadina Avenue on the west from Toronto Harbour north to the city limits just north of St. Clair Avenue. On the east the boundary followed Simcoe Street north from the harbour to Queen Street West. After a short jog east to University Avenue it followed that street north through Queen's Park Crescent and then continued north on Avenue Road through to the city limits just north of St. Clair Avenue West.
Members of Provincial Parliament
| St. Patrick | ||||
|---|---|---|---|---|
| Assembly | Years | Member | Party | |
| Created from parts of Toronto Southwest, Toronto Northeast and Toronto Northwest ridings | ||||
| 17th | 1926–1929 | John Currie | Conservative | |
| 18th | 1929–1934 | Edward Joseph Murphy | Conservative | |
| 19th | 1934–1937 | Frederick Fraser Hunter | Liberal | |
| 20th | 1937–1943 | |||
| 21st | 1943–1945 | Kelso Roberts | Progressive Conservative | |
| 22nd | 1945–1948 | |||
| 23rd | 1948–1951 | Charles Rea | Progressive Conservative | |
| 24th | 1951–1955 | Kelso Roberts | Progressive Conservative | |
| 25th | 1955–1959 | |||
| 26th | 1959–1963 | |||
| 27th | 1963–1967 | |||
| Sourced from the Ontario Legislative Assembly | ||||
| Merged with St. Andrew to form St. Andrew—St. Patrick | ||||
Election results
1926 boundaries
| Party | Candidate | Votes | Vote % | |
|---|---|---|---|---|
| Conservative | John A. Currie | 5,103 | 68.9 | |
| Prohibitionist | John Wanless | 1,834 | 24.8 | |
| Liberal | L.P. Burns | 466 | 6.3 | |
| Total | 7,403 |
| Party | Candidate | Votes | Vote % | |
|---|---|---|---|---|
| Conservative | E.J. Murphy | 4,473 | 66.8 | |
| Liberal | John E. Belfry | 1,242 | 18.5 | |
| Independent-Conservative | H. Currie | 856 | 12.8 | |
| Labour | R.E. Knowles Jr. | 128 | 1.9 | |
| Total | 6,699 |
1934 boundaries
| Party | Candidate | Votes | Vote % | |
|---|---|---|---|---|
| Liberal | Fraser Hunter | 5,751 | 50.2 | |
| Conservative | E. J. Murphy | 5,713 | 49.8 | |
| Total | 11,464 |
| Party | Candidate | Votes | Vote % | |
|---|---|---|---|---|
| Liberal | F.F. Hunter | 6,162 | 48.5 | |
| Conservative | A.K. Roberts | 5,479 | 43.1 | |
| Co-operative Commonwealth | Felix Lazarus | 957 | 7.5 | |
| Independent-Conservative | G.M. Saunders | 119 | 0.9 | |
| Total | 12,717 |
| Party | Candidate | Votes | Vote % | |
|---|---|---|---|---|
| Conservative | A. Kelso Roberts | 4,543 | 44.5 | |
| Liberal | Fred Hamilton | 2,850 | 27.9 | |
| Co-operative Commonwealth | John Osler | 2,817 | 27.6 | |
| Total | 10,210 |
| Party | Candidate | Votes | Vote % | |
|---|---|---|---|---|
| Conservative | A. Kelso Roberts | 7,243 | 50.9 | |
| Co-operative Commonwealth | John Osler | 2,854 | 19.9 | |
| Liberal | J.M. Gould | 2,846 | 19.8 | |
| Labor–Progressive | Sam Walsh | 1,401 | 9.8 | |
| Total | 14,344 |
| Party | Candidate | Votes | Vote % | |
|---|---|---|---|---|
| Conservative | Charles E. Rea | 7,124 | 44.0 | |
| Co-operative Commonwealth | John Osler | 5,483 | 33.9 | |
| Liberal | Lionel Conacher | 3,589 | 22.2 | |
| Total | 16,196 |
| Party | Candidate | Votes | Vote % | |
|---|---|---|---|---|
| Conservative | Kelso Roberts | 7,308 | 57.1 | |
| Co-operative Commonwealth | William Newcombe | 2,972 | 23.2 | |
| Liberal | William A. MacKenzie | 2,518 | 19.7 | |
| Total | 12,978 |
| Party | Candidate | Votes | Vote % | |
|---|---|---|---|---|
| Conservative | Kelso Roberts | 5,150 | 54.6 | |
| Liberal | Donald Plaxton | 2,409 | 25.5 | |
| Co-operative Commonwealth | Bruce Hewlett | 1,543 | 16.4 | |
| Labor–Progressive | Ben Shek | 335 | 3.5 | |
| Total | 9,437 |
| Party | Candidate | Votes | Vote % | |
|---|---|---|---|---|
| Conservative | Kelso Roberts | 5,265 | 59.4 | |
| Liberal | Lance Evans | 2,469 | 27.9 | |
| Co-operative Commonwealth | Bruce Hewlett | 1,127 | 12.7 | |
| Total | 8,861 |
| Party | Candidate | Votes | Vote % | |
|---|---|---|---|---|
| Conservative | Kelso Roberts | 4,820 | 47.7 | |
| Liberal | Mark MacGuigan | 4,042 | 40.0 | |
| New Democrat | Gerald Solway | 1,026 | 10.2 | |
| Communist | Rae Murphy | 152 | 1.5 | |
| Social Credit Action | James Audy | 55 | 0.5 | |
| Total | 10,095 |