Southend West (UK Parliament constituency)
| Southend West | |
|---|---|
|
Borough constituency for the House of Commons | |
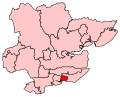 Boundary of Southend West in Essex
| |
 Location of Essex within England
| |
| County | Essex |
| Electorate | 66,780 (December 2010) |
| Major settlements | Southend-on-Sea, Leigh-on-Sea, Westcliff-on-Sea |
| Current constituency | |
| Created | 1950 |
| Member of Parliament | Anna Firth (Conservative) |
| Seats | One |
| Created from | Southend |
Southend West is a constituency in the House of Commons of the UK Parliament. The seat is currently held by Anna Firth who won the 2022 by-election, following the murder of the incumbent MP, David Amess.
Under the 2023 Periodic Review of Westminster constituencies, the constituency is to be renamed Southend West and Leigh - to be first contested at the next general election.
Constituency profile
Registered jobseekers were in November 2012 close to the national average of 3.8%, at 3.5% of the population based on a statistical compilation by The Guardian.
Leigh-on-Sea has a number of Liberal Democrat councillors, whilst Eastwood Park has voted for the Lib Dems on occasion, and there is some Labour strength in Westborough (their strongest ward in the constituency), Blenheim Park and St Laurence, however the remaining areas are predominantly Conservative.
History
The constituency was created for the 1950 general election under the Representation of the People Act 1948, when the Parliamentary Borough of Southend-on-Sea was split in two.
Since creation, the seat has been held every election by the Conservative Party, with majorities ranging from 5.7% during the Labour Landslide of 1997 to 43.4% in 1955. It has historically been seen by pundits as a safe Conservative seat.
Because four members of the Guinness family have held the seat (or its predecessor, Southend) it has been dubbed in political analyses in the media as "Guinness-on-Sea".
The seat was represented by David Amess for 24 years, from 1997 to 15 October 2021, when he was murdered. Amess was previously the MP for Basildon from 1983. A by-election was held to elect a replacement MP. In a similar vein to the subsequent by-election following the murder of Labour MP Jo Cox in 2016, all major contender parties stated they would not field candidates in opposition to the Conservative nominee.
Boundaries and boundary changes
1950–1955
- The County Borough of Southend-on-Sea wards of Chalkwell, Eastwood, Leigh, Milton, Prittlewell, St Clements, Victoria, and Westborough.
Formed primarily from western parts of the abolished Parliamentary Borough of Southend-on-Sea.
1955–1983
- The County Borough of Southend-on-Sea wards of Blenheim, Chalkwell, Eastwood, Leigh, Prittlewell, St Clement's, Southbourne, and Westborough.
Realignment of boundary with Southend East.
1983–2010
- The Borough of Southend-on-Sea wards of Belfairs, Blenheim, Chalkwell, Eastwood, Leigh, Prittlewell, and Westborough.
Marginal changes following the redistribution of wards in the Borough of Southend-on-Sea.
2010–present
- The Borough of Southend-on-Sea wards of Belfairs, Blenheim Park, Chalkwell, Eastwood Park, Leigh, Prittlewell, St Laurence, Westborough, and West Leigh.
Further marginal changes were due to a redistribution of local authority wards.
The constituency comprises a small part of the west of Southend-on-Sea, and includes Leigh-on-Sea and Westcliff-on-Sea. It is bounded to the north and east by Rochford and Southend East, to the north by Rayleigh and Wickford, to the west by Castle Point, and to the south by the very end of the Thames estuary.
Proposed
Further to the 2023 Periodic Review of Westminster constituencies, enacted by the Parliamentary Constituencies Order 2023, the Southend West and Leigh constituency will comprise the whole of the current Southend West seat with the addition of St Luke's ward from Rochford and Southend East).
Members of Parliament
| Election | Member | Party | |
|---|---|---|---|
| 1950 | Sir Henry Channon | Conservative | |
| 1959 by-election | Paul Channon | Conservative | |
| 1997 | Sir David Amess | Conservative | |
| 2022 by-election | Anna Firth | Conservative | |
Elections
Elections in the 2020s
| Party | Candidate | Votes | % | ±% | |
|---|---|---|---|---|---|
| Conservative | Anna Firth | ||||
| Green | Tilly Hogrebe | ||||
| Majority | |||||
| Turnout | |||||
| Party | Candidate | Votes | % | ±% | |
|---|---|---|---|---|---|
| Conservative | Anna Firth | 12,792 | 86.1 | +26.9 | |
| Psychedelic Movement | Jason Pilley | 512 | 3.4 | New | |
| UKIP | Steve Laws | 400 | 2.7 | New | |
| English Democrat | Catherine Blaiklock | 320 | 2.2 | New | |
| Independent | Jayda Fransen | 299 | 2.0 | New | |
| Heritage | Ben Downton | 236 | 1.6 | New | |
| Freedom Alliance | Christopher Anderson | 161 | 1.1 | New | |
| English Constitution | Graham Moore | 86 | 0.6 | New | |
| No description | Olga Childs | 52 | 0.3 | New | |
| Majority | 12,280 | 82.7 | +51.6 | ||
| Turnout | 15,942 | 24.0 | -43.4 | ||
| Rejected ballots | 1,084 | ||||
| Registered electors | 66,354 | ||||
| Conservative hold | Swing | N/A | |||
Elections in the 2010s
| Party | Candidate | Votes | % | ±% | |
|---|---|---|---|---|---|
| Conservative | David Amess | 27,555 | 59.2 | +4.0 | |
| Labour | Aston Line | 13,096 | 28.1 | -5.9 | |
| Liberal Democrats | Nina Stimson | 5,312 | 11.4 | +6.9 | |
| Independent | 77 Joseph | 574 | 1.2 | New | |
| Majority | 14,459 | 31.1 | +9.9 | ||
| Turnout | 46,537 | 67.4 | -2.3 | ||
| Conservative hold | Swing | +4.9 | |||
| Party | Candidate | Votes | % | ±% | |
|---|---|---|---|---|---|
| Conservative | David Amess | 26,046 | 55.2 | +5.4 | |
| Labour | Julian Ware-Lane | 16,046 | 34.0 | +15.7 | |
| Liberal Democrats | Lucy Salek | 2,110 | 4.5 | -4.8 | |
| UKIP | John Stansfield | 1,666 | 3.5 | -14.0 | |
| Green | Dominic Ellis | 831 | 1.8 | -2.9 | |
| Southend Independent Association | Tino Callaghan | 305 | 0.6 | New | |
| Independent | Jason Pilley | 187 | 0.4 | New | |
| Majority | 10,000 | 21.2 | -10.3 | ||
| Turnout | 47,191 | 69.7 | +3.1 | ||
| Conservative hold | Swing | -5.2 | |||
Jack Monroe had previously been standing for the National Health Action Party, before withdrawing their candidacy on 11 May 2017, citing death threats and concern for their health.
| Party | Candidate | Votes | % | ±% | |
|---|---|---|---|---|---|
| Conservative | David Amess | 22,175 | 49.8 | +3.8 | |
| Labour | Julian Ware-Lane | 8,154 | 18.3 | +4.9 | |
| UKIP | Brian Otridge | 7,803 | 17.5 | +13.6 | |
| Liberal Democrats | Paul Collins | 4,129 | 9.3 | -20.1 | |
| Green | Jon Fuller | 2,083 | 4.7 | +3.2 | |
| English Democrat | Jeremy Moss | 165 | 0.4 | -0.9 | |
| Majority | 14,021 | 31.5 | +14.8 | ||
| Turnout | 44,509 | 66.6 | +1.5 | ||
| Conservative hold | Swing | -0.5 | |||
| Party | Candidate | Votes | % | ±% | |
|---|---|---|---|---|---|
| Conservative | David Amess | 20,086 | 46.1 | -0.1 | |
| Liberal Democrats | Peter Welch | 12,816 | 29.4 | +5.4 | |
| Labour | Thomas Flynn | 5,850 | 13.4 | -9.2 | |
| UKIP | Garry Cockrill | 1,714 | 3.9 | +0.5 | |
| BNP | Tony Gladwin | 1,333 | 3.1 | New | |
| Green | Barry Bolton | 644 | 1.5 | New | |
| Independent | Vel (Marimutu Velmurgan) | 617 | 1.4 | New | |
| English Democrat | Terry Phillips | 546 | 1.3 | -0.5 | |
| Majority | 7,270 | 16.7 | -5.8 | ||
| Turnout | 43,606 | 65.1 | +4.0 | ||
| Conservative hold | Swing | −2.8 | |||
Elections in the 2000s
| Party | Candidate | Votes | % | ±% | |
|---|---|---|---|---|---|
| Conservative | David Amess | 18,408 | 46.2 | −0.1 | |
| Liberal Democrats | Peter Wexham | 9,449 | 23.7 | −1.2 | |
| Labour | Jan Etienne | 9,072 | 22.8 | −2.3 | |
| UKIP | Carole Sampson | 1,349 | 3.4 | −0.3 | |
| Independent | Marimutu Velmurgan | 745 | 1.9 | New | |
| English Democrat | Jeremy Moss | 701 | 1.8 | New | |
| Max Power Party | Dan Anslow | 106 | 0.3 | New | |
| Majority | 8,959 | 22.5 | +1.3 | ||
| Turnout | 39,830 | 61.9 | +3.9 | ||
| Conservative hold | Swing | +0.5 | |||
| Party | Candidate | Votes | % | ±% | |
|---|---|---|---|---|---|
| Conservative | David Amess | 17,313 | 46.3 | +7.5 | |
| Labour | Paul Fisher | 9,372 | 25.1 | +2.3 | |
| Liberal Democrats | Richard de Ste Croix | 9,319 | 24.9 | -8.2 | |
| UKIP | Brian Lee | 1,371 | 3.7 | +2.3 | |
| Majority | 7,941 | 21.2 | +15.5 | ||
| Turnout | 37,375 | 58.0 | -12.0 | ||
| Conservative hold | Swing | ||||
Elections in the 1990s
| Party | Candidate | Votes | % | ±% | |
|---|---|---|---|---|---|
| Conservative | David Amess | 18,029 | 38.8 | -15.9 | |
| Liberal Democrats | Nina Stimson | 15,414 | 33.1 | +2.2 | |
| Labour | Alan Harley | 10,600 | 22.8 | +10.5 | |
| Referendum | Charles Webster | 1,734 | 3.7 | New | |
| UKIP | Brian Lee | 636 | 1.4 | New | |
| Natural Law | Peter Warburton | 101 | 0.2 | -0.1 | |
| Majority | 2,615 | 5.7 | -18.1 | ||
| Turnout | 46,515 | 70.0 | -7.8 | ||
| Conservative hold | Swing | ||||
| Party | Candidate | Votes | % | ±% | |
|---|---|---|---|---|---|
| Conservative | Paul Channon | 27,319 | 54.7 | +0.3 | |
| Liberal Democrats | Nina Stimson | 15,417 | 30.9 | -7.2 | |
| Labour | Geoffrey Viney | 6,139 | 12.3 | +4.7 | |
| Liberal | Alan Farmer | 495 | 1.0 | New | |
| Green | Chris Keene | 451 | 0.9 | New | |
| Natural Law | Peter Warburton | 127 | 0.3 | New | |
| Majority | 11,902 | 23.8 | +7.5 | ||
| Turnout | 49,948 | 77.8 | +2.5 | ||
| Conservative hold | Swing | +3.8 | |||
Elections in the 1980s
| Party | Candidate | Votes | % | ±% | |
|---|---|---|---|---|---|
| Conservative | Paul Channon | 28,003 | 54.4 | -0.1 | |
| Liberal | Gavin Grant | 19,603 | 38.1 | +0.2 | |
| Labour Co-op | Angela Smith | 3,899 | 7.6 | +0.0 | |
| Majority | 8,400 | 16.3 | -0.3 | ||
| Turnout | 51,505 | 75.3 | +3.6 | ||
| Conservative hold | Swing | -0.1 | |||
| Party | Candidate | Votes | % | ±% | |
|---|---|---|---|---|---|
| Conservative | Paul Channon | 26,360 | 54.5 | -3.2 | |
| Liberal | Gavin Grant | 18,327 | 37.9 | +13.2 | |
| Labour | Joy Nisbet | 3,675 | 7.6 | -8.7 | |
| Majority | 8,033 | 16.6 | -16.4 | ||
| Turnout | 48,362 | 71.7 | -4.6 | ||
| Conservative hold | Swing | -8.2 | |||
Elections in the 1970s
| Party | Candidate | Votes | % | ±% | |
|---|---|---|---|---|---|
| Conservative | Paul Channon | 29,449 | 57.68 | ||
| Liberal | D Evans | 12,585 | 24.65 | ||
| Labour | J Nisbet | 8,341 | 16.34 | ||
| National Front | LJ McKeon | 680 | 1.33 | New | |
| Majority | 16,864 | 33.03 | |||
| Turnout | 51,055 | 76.25 | |||
| Conservative hold | Swing | ||||
| Party | Candidate | Votes | % | ±% | |
|---|---|---|---|---|---|
| Conservative | Paul Channon | 23,480 | 47.59 | ||
| Liberal | W Greaves | 16,409 | 33.26 | ||
| Labour | AN Wright | 9,451 | 19.15 | ||
| Majority | 7,071 | 14.33 | |||
| Turnout | 49,340 | 73.16 | |||
| Conservative hold | Swing | ||||
| Party | Candidate | Votes | % | ±% | |
|---|---|---|---|---|---|
| Conservative | Paul Channon | 25,040 | 46.68 | ||
| Liberal | W Greaves | 19,885 | 37.07 | ||
| Labour | AN Wright | 14,160 | 23.85 | ||
| Majority | 12,913 | 9.61 | |||
| Turnout | 59,085 | 77.23 | |||
| Conservative hold | Swing | ||||
| Party | Candidate | Votes | % | ±% | |
|---|---|---|---|---|---|
| Conservative | Paul Channon | 29,304 | 60.05 | ||
| Labour | M Burstin | 12,419 | 25.45 | ||
| Liberal | JH Barnett | 7,077 | 14.50 | ||
| Majority | 16,885 | 34.60 | |||
| Turnout | 48,800 | 70.70 | |||
| Conservative hold | Swing | ||||
Elections in the 1960s
| Party | Candidate | Votes | % | ±% | |
|---|---|---|---|---|---|
| Conservative | Paul Channon | 25,713 | 50.89 | ||
| Labour | M Burstin | 13,856 | 27.42 | ||
| Liberal | Gurth Hoyer-Millar | 10,958 | 21.69 | ||
| Majority | 11,857 | 23.47 | |||
| Turnout | 50,527 | 78.35 | |||
| Conservative hold | Swing | ||||
| Party | Candidate | Votes | % | ±% | |
|---|---|---|---|---|---|
| Conservative | Paul Channon | 25,555 | 50.58 | ||
| Liberal | Gurth Hoyer-Millar | 14,548 | 28.79 | ||
| Labour | Rex Winsbury | 10,423 | 20.63 | ||
| Majority | 11,007 | 21.79 | |||
| Turnout | 50,526 | 78.78 | |||
| Conservative hold | Swing | ||||
Elections in the 1950s
| Party | Candidate | Votes | % | ±% | |
|---|---|---|---|---|---|
| Conservative | Paul Channon | 27,612 | 58.2 | -6.0 | |
| Liberal | Heather Harvey | 10,577 | 22.3 | +7.3 | |
| Labour | Anthony Pearson-Clarke | 9,219 | 19.4 | -1.4 | |
| Majority | 17,035 | 35.9 | -7.7 | ||
| Turnout | 47,408 | 77.7 | +3.6 | ||
| Conservative hold | Swing | ||||
| Party | Candidate | Votes | % | ±% | |
|---|---|---|---|---|---|
| Conservative | Paul Channon | 14,493 | 55.6 | -8.6 | |
| Liberal | Heather Harvey | 6,314 | 24.2 | +9.2 | |
| Labour | Anthony Pearson-Clarke | 5,280 | 20.2 | -0.6 | |
| Majority | 5,166 | 31.4 | -12.0 | ||
| Turnout | 26,087 | ||||
| Conservative hold | Swing | ||||
| Party | Candidate | Votes | % | ±% | |
|---|---|---|---|---|---|
| Conservative | Henry Channon | 27,326 | 64.2 | -4.9 | |
| Labour | Victor G Marchesi | 8,866 | 20.8 | -10.1 | |
| Liberal | Heather Harvey | 6,375 | 15.0 | New | |
| Majority | 18,460 | 43.4 | +5.2 | ||
| Turnout | 42,567 | 74.1 | -4.9 | ||
| Conservative hold | Swing | ||||
| Party | Candidate | Votes | % | ±% | |
|---|---|---|---|---|---|
| Conservative | Henry Channon | 39,287 | 69.1 | +11.7 | |
| Labour | Henry N Lyall | 17,352 | 30.9 | +5.0 | |
| Majority | 21,755 | 38.2 | +6.7 | ||
| Turnout | 56,639 | 79.0 | -4.1 | ||
| Conservative hold | Swing | ||||
| Party | Candidate | Votes | % | ±% | |
|---|---|---|---|---|---|
| Conservative | Henry Channon | 34,100 | 57.4 | ||
| Labour Co-op | Eric Hutchison | 15,345 | 25.9 | ||
| Liberal | John Scott | 9,907 | 16.7 | ||
| Majority | 18,746 | 31.5 | |||
| Turnout | 59,352 | 83.1 | |||
| Conservative win (new seat) | |||||