South Shields (UK Parliament constituency)
| South Shields | |
|---|---|
|
Borough constituency for the House of Commons | |
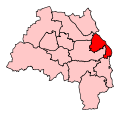 Boundary of South Shields in Tyne and Wear
| |
 Location of Tyne and Wear within England
| |
| County | Tyne and Wear |
| Electorate | 82,294(2011) |
| Current constituency | |
| Created | 1832 |
| Member of Parliament | Emma Lewell-Buck (Labour) |
| Seats | One |
| Created from | County Durham |
South Shields is a borough constituency represented in the House of Commons of the Parliament of the United Kingdom. It elects one Member of Parliament (MP) by the first past the post system of election. It has been represented by Emma Lewell-Buck of the Labour Party since 2013.
The seat was created by the Reform Act 1832 as a single-member parliamentary borough.
The current constituency covers the area of South Shields in the South Tyneside district of Tyne and Wear.
Boundaries
1832-1918
Under the Parliamentary Boundaries Act 1832, the contents of the borough were defined as the Respective Townships of South Shields and Westoe.
See map on Vision of Britain website.
1918–1950
The County Borough of South Shields.
Expanded to be coterminous with County Borough.
1950–1951
As prior but with redrawn boundaries.
Expanded southwards, including the communities of Harton, transferred from Houghton-le-Spring.
1951–1983
As prior but with redrawn boundaries.
1983–1997
The Metropolitan Borough of South Tyneside wards of All Saints, Beacon and Bents, Cleadon Park, Harton, Horsley Hill, Rekendyke, Tyne Dock and Simonside, Westoe, West Park, and Whiteleas.
Minor changes to take account of ward boundaries of the newly formed metropolitan borough, including the transfer of Biddick Hall to Jarrow.
1997–2010
The Metropolitan Borough of South Tyneside wards of All Saints, Beacon and Bents, Biddick Hall, Cleadon Park, Harton, Horsley Hill, Rekendyke, Tyne Dock and Simonside, Westoe, West Park, and Whiteleas.
Biddick Hall gained back from Jarrow.
2010–present
The Metropolitan Borough of South Tyneside wards of Beacon and Bents, Biddick and All Saints, Cleadon Park, Harton, Horsley Hill, Simonside and Rekendyke, Westoe, West Park, Whitburn and Marsden, and Whiteleas.
Boundary changes for the 2010 general election transferred the community of Whitburn into the South Shields constituency from the neighbouring Jarrow seat.
Proposed
Further to the 2023 Periodic Review of Westminster constituencies, enacted by the Parliamentary Constituencies Order 2023, from the next general election, due by January 2025, the constituency will be expanded to bring the electorate within the permitted range, by adding the South Tyneside ward of Cleadon and East Bolden, transferred from Jarrow (to be abolished).
Members of Parliament
The seat was held from 2001 to 2013 by David Miliband, who served as Foreign Secretary from 2007 until Labour's general election defeat of 2010. On 26 March 2013 Miliband announced his resignation from Parliament in order to take up a post as the head of the International Rescue Committee in New York City.

With two exceptions (Arthur Blenkinsop and Emma Lewell-Buck) every South Shields MP since 1929 has been a cabinet member at some point in their career. However, Blenkinsop was a junior minister, and Lewell-Buck has been a shadow minister. Two of them, Chuter Ede (Home Secretary) and Miliband (Foreign Secretary), have held one of the Great Offices of State while MP for South Shields.
The Open Spaces Society in 2013 observed that there has been a tradition of South Shields MPs, from Chuter Ede onwards, promoting the cause of public access and common land.
Elections
Elections in the 2010s
| Party | Candidate | Votes | % | ±% | |
|---|---|---|---|---|---|
| Labour | Emma Lewell-Buck | 17,273 | 45.6 | -15.9 | |
| Conservative | Oni Oviri | 7,688 | 20.3 | -5.6 | |
| Brexit Party | Glenn Thompson | 6,446 | 17.0 | New | |
| Independent | Geoff Thompson | 3,658 | 9.7 | New | |
| Liberal Democrats | William Shepherd | 1,514 | 4.0 | +2.3 | |
| Green | Sarah McKeown | 1,303 | 3.4 | -0.1 | |
| Majority | 9,585 | 25.3 | -10.3 | ||
| Turnout | 37,882 | 60.3 | -4.0 | ||
| Labour hold | Swing | -5.2 | |||
| Party | Candidate | Votes | % | ±% | |
|---|---|---|---|---|---|
| Labour | Emma Lewell-Buck | 25,078 | 61.5 | +10.2 | |
| Conservative | Felicity Buchan | 10,570 | 25.9 | +9.3 | |
| UKIP | Richard Elvin | 3,006 | 7.4 | -14.6 | |
| Green | Shirley Ford | 1,437 | 3.5 | -1.0 | |
| Liberal Democrats | Gita Gordon | 681 | 1.7 | -0.1 | |
| Majority | 14,508 | 35.6 | +6.3 | ||
| Turnout | 40,772 | 64.3 | +6.5 | ||
| Labour hold | Swing | ||||
| Party | Candidate | Votes | % | ±% | |
|---|---|---|---|---|---|
| Labour | Emma Lewell-Buck | 18,589 | 51.3 | −0.7 | |
| UKIP | Norman Dennis | 7,975 | 22.0 | N/A | |
| Conservative | Robert Oliver | 6,021 | 16.6 | −5.0 | |
| Green | Shirley Ford | 1,614 | 4.5 | +2.4 | |
| Independent | Lisa Nightingale | 1,427 | 3.9 | New | |
| Liberal Democrats | Gitanjali (Gita) Gordon | 639 | 1.8 | −12.4 | |
| Majority | 10,614 | 29.3 | −1.1 | ||
| Turnout | 36,265 | 57.8 | +0.1 | ||
| Labour hold | Swing | ||||
| Party | Candidate | Votes | % | ±% | |
|---|---|---|---|---|---|
| Labour | Emma Lewell-Buck | 12,493 | 50.4 | −1.6 | |
| UKIP | Richard Elvin | 5,988 | 24.2 | New | |
| Conservative | Karen Allen | 2,857 | 11.5 | −10.1 | |
| Independent | Ahmed Khan | 1,331 | 5.4 | New | |
| Independent Socialist Party | Phil Brown | 750 | 3.0 | New | |
| BNP | Dorothy Brookes | 711 | 2.9 | −3.6 | |
| Liberal Democrats | Hugh Annand | 352 | 1.4 | −12.8 | |
| Monster Raving Loony | Howling Laud Hope | 197 | 0.8 | New | |
| Independent | Thomas Darwood | 57 | 0.2 | New | |
| Majority | 6,505 | 26.2 | -4.2 | ||
| Turnout | 24,780 | 39.3 | −18.4 | ||
| Labour hold | Swing | ||||
| Party | Candidate | Votes | % | ±% | |
|---|---|---|---|---|---|
| Labour | David Miliband | 18,995 | 52.0 | −8.5 | |
| Conservative | Karen Allen | 7,886 | 21.6 | +4.4 | |
| Liberal Democrats | Stephen Psallidas | 5,189 | 14.2 | −5.5 | |
| BNP | Donna Watson | 2,382 | 6.5 | New | |
| Green | Shirley Ford | 762 | 2.1 | New | |
| Independent | Siamak Kaikavoosi | 729 | 2.0 | New | |
| Independent | Victor Thomson | 316 | 0.9 | New | |
| Independent | Sam Navabi | 168 | 0.5 | New | |
| Fight for an Anti-War Government | Roger Nettleship | 91 | 0.2 | New | |
| Majority | 11,109 | 30.4 | -10.4 | ||
| Turnout | 36,518 | 57.7 | +6.8 | ||
| Labour hold | Swing | ||||
Elections in the 2000s
| Party | Candidate | Votes | % | ±% | |
|---|---|---|---|---|---|
| Labour | David Miliband | 18,269 | 60.5 | −2.7 | |
| Liberal Democrats | Stephen Psallidas | 5,957 | 19.7 | +2.9 | |
| Conservative | Richard Lewis | 5,207 | 17.2 | +0.3 | |
| Independent | Nader Afshari-Naderi | 773 | 2.6 | New | |
| Majority | 12,312 | 40.8 | −5.5 | ||
| Turnout | 30,206 | 50.9 | +1.2 | ||
| Labour hold | Swing | ||||
| Party | Candidate | Votes | % | ±% | |
|---|---|---|---|---|---|
| Labour | David Miliband | 19,230 | 63.2 | −8.2 | |
| Conservative | Joanna Gardner | 5,140 | 16.9 | +2.3 | |
| Liberal Democrats | Marshall Grainger | 5,127 | 16.8 | +8.0 | |
| UKIP | Alan Hardy | 689 | 2.3 | New | |
| Independent | Roger Nettleship | 262 | 0.9 | New | |
| Majority | 14,090 | 46.3 | −10.5 | ||
| Turnout | 30,448 | 49.7 | −12.8 | ||
| Labour hold | Swing | −5.3 | |||
Elections in the 1990s
| Party | Candidate | Votes | % | ±% | |
|---|---|---|---|---|---|
| Labour | David Clark | 27,834 | 71.4 | +11.6 | |
| Conservative | Mark Hoban | 5,681 | 14.6 | −12.8 | |
| Liberal Democrats | David Ord | 3,429 | 8.8 | −4.0 | |
| Referendum | Alan Lorriane | 1,660 | 4.3 | New | |
| Independent | Ian Wilburn | 374 | 1.0 | New | |
| Majority | 22,153 | 56.8 | +24.4 | ||
| Turnout | 38,978 | 62.5 | −7.6 | ||
| Labour hold | Swing | +12.2 | |||
| Party | Candidate | Votes | % | ±% | |
|---|---|---|---|---|---|
| Labour | David Clark | 24,876 | 59.8 | +1.9 | |
| Conservative | Jonathan L Howard | 11,399 | 27.4 | +1.7 | |
| Liberal Democrats | Arthur Preece | 5,344 | 12.8 | -2.7 | |
| Majority | 13,477 | 32.4 | +0.2 | ||
| Turnout | 41,619 | 70.1 | −0.6 | ||
| Labour hold | Swing | +0.1 | |||
Elections in the 1980s
| Party | Candidate | Votes | % | ±% | |
|---|---|---|---|---|---|
| Labour | David Clark | 24,882 | 57.9 | +11.4 | |
| Conservative | Michael Fabricant | 11,031 | 25.7 | −5.2 | |
| SDP | Margaret Melling | 6,654 | 15.5 | −7.2 | |
| Democrat | Edward Dunn | 408 | 1.0 | New | |
| Majority | 13,851 | 32.2 | +16.6 | ||
| Turnout | 42,975 | 70.7 | +4.5 | ||
| Labour hold | Swing | +8.2 | |||
| Party | Candidate | Votes | % | ±% | |
|---|---|---|---|---|---|
| Labour | David Clark | 19,055 | 46.5 | -10.5 | |
| Conservative | Peter Groves | 12,653 | 30.9 | -0.1 | |
| SDP | Peter Angus | 9,288 | 22.7 | +10.7 | |
| Majority | 6,402 | 15.6 | -10.4 | ||
| Turnout | 40,996 | 66.2 | -5.0 | ||
| Labour hold | Swing | -5.2 | |||
Elections in the 1970s
| Party | Candidate | Votes | % | ±% | |
|---|---|---|---|---|---|
| Labour | David Clark | 28,675 | 57.0 | +0.6 | |
| Conservative | R Booth | 15,551 | 31.0 | +6.2 | |
| Liberal | L Monger | 6,003 | 12.0 | -5.3 | |
| Majority | 13,124 | 26.0 | -5.6 | ||
| Turnout | 50,229 | 71.2 | +6.5 | ||
| Labour hold | Swing | -2.8 | |||
| Party | Candidate | Votes | % | ±% | |
|---|---|---|---|---|---|
| Labour | Arthur Blenkinsop | 26,492 | 56.4 | -3.3 | |
| Conservative | NS Smith | 11,667 | 24.8 | -11.6 | |
| Liberal | L Garbutt | 8,106 | 17.3 | New | |
| National Front | W Owen | 711 | 1.5 | -2.3 | |
| Majority | 14,825 | 31.6 | +8.3 | ||
| Turnout | 46,976 | 64.7 | -6.9 | ||
| Labour hold | Swing | +4.1 | |||
| Party | Candidate | Votes | % | ±% | |
|---|---|---|---|---|---|
| Labour | Arthur Blenkinsop | 30,740 | 59.7 | -0.5 | |
| Conservative | S Smith | 18,754 | 36.4 | -3.4 | |
| National Front | W Owen | 1,958 | 3.8 | New | |
| Majority | 11,986 | 23.3 | +2.9 | ||
| Turnout | 51,452 | 71.6 | +4.8 | ||
| Labour hold | Swing | +1.9 | |||
| Party | Candidate | Votes | % | ±% | |
|---|---|---|---|---|---|
| Labour | Arthur Blenkinsop | 30,191 | 60.2 | -4.5 | |
| Conservative | John McKee | 19,960 | 39.8 | +4.5 | |
| Majority | 10,231 | 20.4 | -9.0 | ||
| Turnout | 50,151 | 66.8 | -1.9 | ||
| Labour hold | Swing | -4.5 | |||
Elections in the 1960s
| Party | Candidate | Votes | % | ±% | |
|---|---|---|---|---|---|
| Labour | Arthur Blenkinsop | 31,829 | 64.7 | +9.6 | |
| Conservative | Charles MacKenzie Dallas | 17,340 | 35.3 | +5.0 | |
| Majority | 14,489 | 29.4 | +4.6 | ||
| Turnout | 49,169 | 68.7 | -5.4 | ||
| Labour hold | Swing | +2.35 | |||
| Party | Candidate | Votes | % | ±% | |
|---|---|---|---|---|---|
| Labour | Arthur Blenkinsop | 29,694 | 55.1 | -2.9 | |
| Conservative | John Chalmers | 16,344 | 30.3 | -11.7 | |
| Liberal | Thomas Henry Campbell Wardlaw | 7,837 | 14.6 | New | |
| Majority | 13,350 | 24.8 | +8.8 | ||
| Turnout | 53,875 | 74.1 | -0.3 | ||
| Labour hold | Swing | +4.45 | |||
Elections in the 1950s
| Party | Candidate | Votes | % | ±% | |
|---|---|---|---|---|---|
| Labour | Chuter Ede | 32,577 | 58.0 | -1.6 | |
| Conservative | John Chalmers | 23,638 | 42.0 | +1.6 | |
| Majority | 8,939 | 16.0 | -3.2 | ||
| Turnout | 56,215 | 74.4 | 0.0 | ||
| Labour hold | Swing | -1.7 | |||
| Party | Candidate | Votes | % | ±% | |
|---|---|---|---|---|---|
| Labour | Chuter Ede | 31,734 | 59.6 | +3.7 | |
| Conservative | John Chalmers | 21,482 | 40.4 | +6.9 | |
| Majority | 10,252 | 19.2 | -3.1 | ||
| Turnout | 53,216 | 74.4 | -9.3 | ||
| Labour hold | Swing | -1.6 | |||
| Party | Candidate | Votes | % | ±% | |
|---|---|---|---|---|---|
| Labour | Chuter Ede | 33,633 | 56.0 | -0.5 | |
| Conservative | John Chalmers | 20,208 | 33.6 | +6.7 | |
| Liberal | Charles Jonathan Kitchell | 6,270 | 10.4 | -5.6 | |
| Majority | 13,425 | 22.4 | -7.2 | ||
| Turnout | 60,111 | 80.5 | -1.2 | ||
| Labour hold | Swing | -3.7 | |||
| Party | Candidate | Votes | % | ±% | |
|---|---|---|---|---|---|
| Labour | Chuter Ede | 33,452 | 56.5 | -2.9 | |
| Conservative | John Chalmers | 15,897 | 28.9 | N/A | |
| Liberal | John George | 9,446 | 16.0 | N/A | |
| Communist | FO Smith | 415 | 0.7 | New | |
| Majority | 17,555 | 29.6 | +10.8 | ||
| Turnout | 59,210 | 81.7 | +8.6 | ||
| Labour hold | Swing | +5.4 | |||
Elections in the 1940s
| Party | Candidate | Votes | % | ±% | |
|---|---|---|---|---|---|
| Labour | Chuter Ede | 22,410 | 59.4 | +11.2 | |
| National Liberal | Donald Maurice Parry | 15,296 | 40.6 | New | |
| Majority | 7,114 | 18.8 | -1.1 | ||
| Turnout | 37,706 | 73.1 | +0.3 | ||
| Labour hold | Swing | +12.6 | |||
Elections in the 1930s
| Party | Candidate | Votes | % | ±% | |
|---|---|---|---|---|---|
| Labour | Chuter Ede | 22,031 | 48.16 | ||
| Liberal | Harcourt Johnstone | 12,932 | 29.27 | ||
| National Labour | Frederick Burden | 10,784 | 23.57 | New | |
| Majority | 9,099 | 19.89 | N/A | ||
| Turnout | 45,747 | 72.79 | |||
| Labour gain from Liberal | Swing | ||||
| Party | Candidate | Votes | % | ±% | |
|---|---|---|---|---|---|
| Liberal | Harcourt Johnstone | 30,528 | 59.81 | ||
| Labour | Chuter Ede | 20,512 | 40.19 | ||
| Majority | 10,016 | 19.62 | N/A | ||
| Turnout | 51,040 | 80.13 | |||
| Liberal gain from Labour | Swing | ||||
Elections in the 1920s
| Party | Candidate | Votes | % | ±% | |
|---|---|---|---|---|---|
| Labour | Chuter Ede | 18,938 | 42.2 | +0.1 | |
| Liberal | Harold Burge Robson | 18,898 | 42.0 | -15.9 | |
| Unionist | William Nunn | 7,110 | 15.8 | New | |
| Majority | 40 | 0.2 | N/A | ||
| Turnout | 44,946 | 72.9 | -2.4 | ||
| Labour gain from Liberal | Swing | +8.0 | |||
| Party | Candidate | Votes | % | ±% | |
|---|---|---|---|---|---|
| Liberal | Edward Harney | 23,171 | 57.9 | -1.4 | |
| Labour | William Lawther | 16,852 | 42.1 | +1.4 | |
| Majority | 6,319 | 15.8 | -2.8 | ||
| Turnout | 40,023 | 75.3 | +1.8 | ||
| Liberal hold | Swing | -1.4 | |||
| Party | Candidate | Votes | % | ±% | |
|---|---|---|---|---|---|
| Liberal | Edward Harney | 22,912 | 59.3 | +19.5 | |
| Labour | William Lawther | 15,717 | 40.7 | +1.0 | |
| Majority | 7,195 | 18.6 | +18.5 | ||
| Turnout | 28,629 | 73.5 | -2.7 | ||
| Liberal hold | Swing | +9.5 | |||
| Party | Candidate | Votes | % | ±% | |
|---|---|---|---|---|---|
| Liberal | Edward Harney | 15,760 | 39.8 | N/A | |
| Labour | William Lawther | 15,735 | 39.7 | +14.9 | |
| National Liberal | Havelock Wilson | 8,121 | 20.5 | -54.7 | |
| Majority | 25 | 0.1 | -50.3 | ||
| Turnout | 39,616 | 76.2 | +24.9 | ||
| Liberal hold | Swing | N/A | |||
Elections in the 1910s
| Party | Candidate | Votes | % | ±% | |
|---|---|---|---|---|---|
| C | Liberal | Havelock Wilson | 19,514 | 75.2 | N/A |
| Labour | George John Rowe | 6,425 | 24.8 | New | |
| Majority | 13,089 | 50.4 | N/A | ||
| Turnout | 25,939 | 51.3 | N/A | ||
| Liberal hold | |||||
| C indicates candidate endorsed by the coalition government. | |||||
| Party | Candidate | Votes | % | ±% | |
|---|---|---|---|---|---|
| Liberal | Havelock Wilson | Unopposed | |||
| Liberal hold | |||||
| Party | Candidate | Votes | % | ±% | |
|---|---|---|---|---|---|
| Liberal | Cecil Cochrane | Unopposed | |||
| Liberal hold | |||||
| Party | Candidate | Votes | % | ±% | |
|---|---|---|---|---|---|
| Liberal | Russell Rea | Unopposed | |||
| Liberal hold | |||||
| Party | Candidate | Votes | % | ±% | |
|---|---|---|---|---|---|
| Liberal | Russell Rea | 7,929 | 61.8 | −3.4 | |
| Liberal Unionist | Roland Edmund Lomax Vaughan Williams | 4,910 | 38.2 | +3.4 | |
| Majority | 3,019 | 23.6 | −6.8 | ||
| Turnout | 12,839 | 70.1 | −6.0 | ||
| Registered electors | 18,320 | ||||
| Liberal hold | Swing | −3.4 | |||
| Party | Candidate | Votes | % | ±% | |
|---|---|---|---|---|---|
| Liberal | William Robson | 9,090 | 65.2 | -8.7 | |
| Liberal Unionist | Roland Edmund Lomax Vaughan Williams | 4,854 | 34.8 | +8.7 | |
| Majority | 4,236 | 30.4 | −17.4 | ||
| Turnout | 13,944 | 76.1 | +3.5 | ||
| Registered electors | 18,320 | ||||
| Liberal hold | Swing | -8.7 | |||
Elections in the 1900s
| Party | Candidate | Votes | % | ±% | |
|---|---|---|---|---|---|
| Liberal | William Robson | 9,717 | 73.9 | +9.6 | |
| Conservative | A R Chamberlayne | 3,431 | 26.1 | −9.6 | |
| Majority | 6,286 | 47.8 | +19.2 | ||
| Turnout | 13,148 | 72.6 | +0.6 | ||
| Registered electors | 18,106 | ||||
| Liberal hold | Swing | +9.6 | |||
| Party | Candidate | Votes | % | ±% | |
|---|---|---|---|---|---|
| Liberal | William Robson | 7,417 | 64.3 | +13.6 | |
| Conservative | R Readhead | 4,119 | 35.7 | −13.6 | |
| Majority | 3,298 | 28.6 | +27.2 | ||
| Turnout | 11,536 | 72.0 | +2.2 | ||
| Registered electors | 16,033 | ||||
| Liberal hold | Swing | +13.6 | |||
Elections in the 1890s
| Party | Candidate | Votes | % | ±% | |
|---|---|---|---|---|---|
| Liberal | William Robson | 5,057 | 50.7 | −4.9 | |
| Conservative | Henry Herbert Wainwright | 4,924 | 49.3 | +4.9 | |
| Majority | 133 | 1.4 | −9.8 | ||
| Turnout | 9,981 | 69.8 | +2.5 | ||
| Registered electors | 14,307 | ||||
| Liberal hold | Swing | −4.9 | |||
| Party | Candidate | Votes | % | ±% | |
|---|---|---|---|---|---|
| Liberal | James Cochran Stevenson | 4,965 | 55.6 | N/A | |
| Conservative | Henry Herbert Wainwright | 3,958 | 44.4 | New | |
| Majority | 1,007 | 11.2 | N/A | ||
| Turnout | 8,923 | 67.3 | N/A | ||
| Registered electors | 13,259 | ||||
| Liberal hold | |||||
Elections in the 1880s
| Party | Candidate | Votes | % | ±% | |
|---|---|---|---|---|---|
| Liberal | James Cochran Stevenson | Unopposed | |||
| Liberal hold | |||||
| Party | Candidate | Votes | % | ±% | |
|---|---|---|---|---|---|
| Liberal | James Cochran Stevenson | 4,064 | 56.5 | −18.4 | |
| Conservative | William Digby Seymour | 3,128 | 43.5 | +18.4 | |
| Majority | 936 | 13.0 | −36.8 | ||
| Turnout | 7,192 | 60.3 | +0.4 | ||
| Registered electors | 11,928 | ||||
| Liberal hold | Swing | −18.4 | |||
| Party | Candidate | Votes | % | ±% | |
|---|---|---|---|---|---|
| Liberal | James Cochran Stevenson | 4,435 | 74.9 | N/A | |
| Conservative | Henry Best Hans-Hamilton | 1,486 | 25.1 | New | |
| Majority | 2,949 | 49.8 | N/A | ||
| Turnout | 5,921 | 59.9 | N/A | ||
| Registered electors | 9,893 | ||||
| Liberal hold | |||||
Elections in the 1870s
| Party | Candidate | Votes | % | ±% | |
|---|---|---|---|---|---|
| Liberal | James Cochran Stevenson | Unopposed | |||
| Registered electors | 8,870 | ||||
| Liberal hold | |||||
Elections in the 1860s
| Party | Candidate | Votes | % | ±% | |
|---|---|---|---|---|---|
| Liberal | James Cochran Stevenson | 2,582 | 53.1 | N/A | |
| Liberal | Charles Palmer | 2,277 | 46.9 | N/A | |
| Majority | 305 | 6.2 | N/A | ||
| Turnout | 4,859 | 78.3 | N/A | ||
| Registered electors | 6,208 | ||||
| Liberal hold | |||||
| Party | Candidate | Votes | % | ±% | |
|---|---|---|---|---|---|
| Liberal | Robert Ingham | Unopposed | |||
| Registered electors | 1,113 | ||||
| Liberal hold | |||||
Elections in the 1850s
| Party | Candidate | Votes | % | ±% | |
|---|---|---|---|---|---|
| Liberal | Robert Ingham | 506 | 62.8 | N/A | |
| Liberal | John Wawn | 300 | 37.2 | N/A | |
| Majority | 206 | 25.6 | N/A | ||
| Turnout | 806 | 71.6 | N/A | ||
| Registered electors | 1,126 | ||||
| Liberal hold | |||||
| Party | Candidate | Votes | % | ±% | |
|---|---|---|---|---|---|
| Whig | Robert Ingham | Unopposed | |||
| Registered electors | 1,079 | ||||
| Whig hold | |||||
| Party | Candidate | Votes | % | ±% | |
|---|---|---|---|---|---|
| Whig | Robert Ingham | 430 | 63.3 | −2.1 | |
| Conservative | Henry Liddell | 249 | 36.7 | +2.1 | |
| Majority | 181 | 26.6 | −4.2 | ||
| Turnout | 679 | 73.4 | +5.0 | ||
| Registered electors | 925 | ||||
| Whig gain from Radical | Swing | −2.1 | |||
Elections in the 1840s
| Party | Candidate | Votes | % | ±% | |
|---|---|---|---|---|---|
| Radical | John Wawn | 333 | 65.4 | +15.5 | |
| Conservative | William Whateley | 176 | 34.6 | −15.5 | |
| Majority | 157 | 30.8 | +23.9 | ||
| Turnout | 509 | 68.4 | −2.8 | ||
| Registered electors | 744 | ||||
| Radical hold | Swing | +15.5 | |||
| Party | Candidate | Votes | % | ±% | |
|---|---|---|---|---|---|
| Radical | John Wawn | 240 | 49.9 | New | |
| Conservative | Robert Ingham | 207 | 43.0 | N/A | |
| Conservative | George Fyler | 34 | 7.1 | N/A | |
| Majority | 33 | 6.9 | N/A | ||
| Turnout | 481 | 71.2 | N/A | ||
| Registered electors | 676 | ||||
| Radical gain from Conservative | Swing | N/A | |||
Elections in the 1830s
| Party | Candidate | Votes | % | ||
|---|---|---|---|---|---|
| Conservative | Robert Ingham | Unopposed | |||
| Registered electors | 644 | ||||
| Conservative hold | |||||
| Party | Candidate | Votes | % | ±% | |
|---|---|---|---|---|---|
| Conservative | Robert Ingham | 273 | 68.1 | +19.2 | |
| Whig | Russell Bowlby | 128 | 31.9 | +31.4 | |
| Majority | 145 | 36.2 | +13.1 | ||
| Turnout | 401 | 77.4 | −10.8 | ||
| Registered electors | 518 | ||||
| Conservative hold | Swing | −6.1 | |||
| Party | Candidate | Votes | % | ||
|---|---|---|---|---|---|
| Tory | Robert Ingham | 205 | 48.9 | ||
| Tory | George Palmer | 108 | 25.8 | ||
| Whig | William Gowan | 104 | 24.8 | ||
| Whig | Russell Bowlby | 2 | 0.5 | ||
| Majority | 97 | 23.1 | |||
| Turnout | 419 | 88.2 | |||
| Registered electors | 475 | ||||
| Tory win (new seat) | |||||