San Jose, Dinagat Islands
San Jose | |
|---|---|
| Municipality of San Jose | |
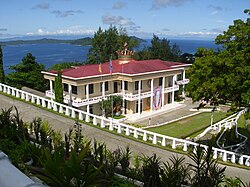 PBMA Founder's Shrine, San Jose
| |
 Flag
 Seal
| |
 Map of Dinagat Islands with San Jose highlighted
| |
|
OpenStreetMap
| |
 San Jose Location within the Philippines
| |
| Coordinates: 10°00′30″N 125°35′20″E | |
| Country | Philippines |
| Region | Caraga |
| Province | Dinagat Islands |
| District | Lone district |
| Founded | November 15, 1989 |
| Barangays | 12 (see Barangays) |
| Government | |
| • Type | Sangguniang Bayan |
| • Mayor | Yngwie Hero B. Ecleo |
| • Vice Mayor | Ruben J D. Zuniega |
| • Representative | Alan 1 B. Ecleo |
| • Municipal Council | Members |
| • Electorate | 16,485 voters (2022) |
| Area | |
| • Total | 27.80 km2 (10.73 sq mi) |
| Elevation | 24 m (79 ft) |
| Highest elevation | 297 m (974 ft) |
| Lowest elevation | 0 m (0 ft) |
| Population
(2020 census)
| |
| • Total | 26,375 |
| • Density | 950/km2 (2,500/sq mi) |
| • Households | 6,530 |
| Economy | |
| • Income class | 4th municipal income class |
| • Poverty incidence |
27.63 |
| • Revenue | ₱ 102.4 million (2020) |
| • Assets | ₱ 194.2 million (2020) |
| • Expenditure | ₱ 93.63 million (2020) |
| • Liabilities | ₱ 33.35 million (2020) |
| Service provider | |
| • Electricity | Dinagat Island Electric Cooperative (DIELCO) |
| Time zone | UTC+8 (PST) |
| ZIP code | 8427 |
| PSGC | |
| IDD : area code | +63 (0)86 |
| Native languages | Surigaonon Cebuano Tagalog |
| Website | www |
San Jose, officially the Municipality of San Jose (Surigaonon: Lungsod nan San Jose; Cebuano: Lungsod sa San Jose; Tagalog: Bayan ng San Jose), is a 4th class municipality and capital of the province of Dinagat Islands, Philippines. According to the 2020 census, it has a population of 26,375 people.
San Jose is the seat of the Philippine Benevolent Missionaries Association (PBMA).
History
The Municipality of San Jose was named in honor of Jose Ecleo who was its pioneer and the father of the late renowned mayor of the Municipality of Dinagat.
It was once a part of the municipality of Dinagat. Even then, San Jose has been significantly progressive compared with the Poblacion until its creation as a municipality on November 15, 1989, by virtue of Republic Act No. 6769 authored by Glenda B. Ecleo, during the time of President Corazon C. Aquino. The creation was amended on December 20, 2009, an act to amend Section 1 of the above-mentioned Republic Act through Republic Act 9859 covering an area of 3,422 hectares. It was within its jurisdiction twelve (12) barangays namely; San Jose, Matingbe, Aurelio, Jacquez, San Juan, Mahayahay, Don Ruben, Justiniana Edera, Santa Cruz, Cuarinta, Wilson and Luna.
San Jose has many roads, a commercial establishment, a concrete port, a college and other urban uses not common to rural communities.
Cityhood
In the 19th Congress of the Philippines, house bills were filed by various representatives which seeks San Jose including other capital towns of provinces with no current component cities, independent component cities or highly urbanized cities to automatically convert into cities.
Geography
Barangays
San Jose is politically subdivided into 12 barangays. Each barangay consists of puroks while some have sitios.
- Aurelio
- Cuarinta
- Don Ruben Ecleo
- Jacquez
- Justiniana Edera
- Luna
- Mahayahay
- Matingbe
- San Jose (Poblacion)
- San Juan
- Santa Cruz
- Wilson
Climate
| Climate data for San Jose, Dinagat Islands | |||||||||||||
|---|---|---|---|---|---|---|---|---|---|---|---|---|---|
| Month | Jan | Feb | Mar | Apr | May | Jun | Jul | Aug | Sep | Oct | Nov | Dec | Year |
| Mean daily maximum °C (°F) | 27 (81) |
27 (81) |
28 (82) |
29 (84) |
30 (86) |
29 (84) |
29 (84) |
29 (84) |
29 (84) |
29 (84) |
28 (82) |
28 (82) |
29 (83) |
| Mean daily minimum °C (°F) | 23 (73) |
22 (72) |
22 (72) |
23 (73) |
24 (75) |
25 (77) |
24 (75) |
24 (75) |
24 (75) |
24 (75) |
24 (75) |
23 (73) |
24 (74) |
| Average precipitation mm (inches) | 210 (8.3) |
161 (6.3) |
123 (4.8) |
85 (3.3) |
148 (5.8) |
186 (7.3) |
164 (6.5) |
157 (6.2) |
141 (5.6) |
190 (7.5) |
223 (8.8) |
200 (7.9) |
1,988 (78.3) |
| Average rainy days | 21.0 | 16.8 | 18.5 | 18.2 | 24.9 | 27.7 | 28.4 | 27.0 | 26.1 | 27.6 | 24.6 | 22.0 | 282.8 |
| Source: Meteoblue | |||||||||||||
Demographics
| Year | Pop. | ±% p.a. |
|---|---|---|
| 1990 | 30,405 | — |
| 1995 | 27,481 | −1.88% |
| 2000 | 25,532 | −1.56% |
| 2007 | 28,398 | +1.48% |
| 2010 | 31,035 | +3.28% |
| 2015 | 27,487 | −2.29% |
| 2020 | 26,375 | −0.81% |
| Source: Philippine Statistics Authority | ||
Economy