Queensland Labor Party
Queensland Labor Queensland Labor Party
| |
|---|---|
| Leader | Steven Miles |
| Deputy Leader | Cameron Dick |
| President | John Battams |
| Secretary | Kate Flanders |
| Founded | 5 August 1892 |
| Headquarters | TLC Building, South Brisbane, Queensland |
| Newspaper | Queensland Labor Times |
| Think tank | T. J. Ryan Foundation |
| Youth wing | Young Labor |
| Women's wing | Labor Women's Network |
| LGBT wing | Rainbow Labor |
| Membership (2021) |
|
| Ideology | |
| Political position |
|
| National affiliation | Australian Labor |
| Union affiliate | QCU |
| Colours | Red |
| Slogan | "Putting Queenslanders First." |
| Legislative Assembly |
52 / 93 |
| House of Representatives |
5 / 30 (Qld seats)
|
| Senate |
3 / 12 (Qld seats)
|
| Website | |
| queenslandlabor | |
| Seats in local government | |
|---|---|
| Brisbane |
5 / 26 |
| Ipswich |
3 / 9 |
| Logan |
4 / 12 |
| Mackay |
1 / 11 |
| Moreton Bay |
2 / 12 |
| Toowoomba |
2 / 11 |
The Queensland Labor Party, officially known as the Australian Labor Party (State of Queensland) and commonly referred to simply as Queensland Labor, is the state branch of the Australian Labor Party (ALP) in the state of Queensland. It has functioned in the state since the 1880s. The Queensland branch of the Australian Labor Party (ALP) was the first Labour Party to win government in the world, when, in December 1899, following the resignation of the Dickson ministry, Labour Leader Anderson Dawson accepted to form a ministry by Lieutenant-Governor Samuel Griffith.
History
Trade unionists in Queensland had begun attempting to secure parliamentary representation as early as the mid-1880s. William McNaughton Galloway, the president of the Seamen's Union, mounted an unsuccessful campaign as an independent in an 1886 by-election. A Workers' Political Reform Association was founded to nominate candidates for the 1888 election, at which the Brisbane Trades and Labor Council endorsed six candidates. Thomas Glassey won the seat of Bundamba at that election, becoming the first self-identified "labor" MP in Queensland. The Queensland Provincial Council of the Australian Labor Federation was formed in 1889 in an attempt to unite Labor campaign efforts. Tommy Ryan won the seat of Barcoo for the labour movement-run People's Parliamentary Association in 1892, and the Labor Party was formally established in Queensland following the first Labor-in-Politics Convention later that year.
The Queensland branch subsequently formed the first Labor government in Australia, albeit briefly, when Anderson Dawson took office for a week in 1899 after a falling out between the non-Labor forces.
Since 1989, when the party came back to power after thirty-two years in Opposition, all its leaders have become Premiers despite two spells in Opposition in 1996–98 and 2012–2015.
As of 2020, the Queensland branch has three factions: the right, headed by Annastacia Palaszczuk, the left, headed by Steven Miles, and the centralist faction, the Old Guard. Discounting Speaker Curtis Pitt, of the 47 Labor MPs, 24 belong to the Left, 16 to the Right, and 7 to the Old Guard.
As of the 2020 state election, Queensland Labor's seat distribution was as follows:
| Region | Electorates | Labor seats | % | |
|---|---|---|---|---|
| North & Far North Queensland (N/FNQ) | 10 | 7 | 70.00 | |
| South East Queensland (SEQ) | 63 | 38 | 60.32 | |
| Wide Bay–Burnett | 5 | 3 | 60.00 | |
| Central Queensland (CQ) | 7 | 3 | 42.86 | |
| Mackay, Isaac and Whitsunday | 3 | 1 | 33.33 | |
| Darling Downs–South West | 5 | — | — | |
Membership and voter base
Historically (1910s–1960s) Queensland Labor's voter base and membership has been distributed fairly equitably across the metropolitan, urban, and rural areas of the state, although maintaining a demographic majority within the South East region. Beginning in the 1970s, Queensland Labor's voter base in particular has swayed more heavily toward the metropolitan and urban areas of the state such as Brisbane, the Sunshine Coast, the Gold Coast, and Townsville, with the Country (later National) and Liberal parties competing with Labor in both regions as an electoral bloc.
Membership figures
|
|
Leaders
Leader
The full list below is the official record of parliamentary leaders:
| No. | Leader (birth–death) |
Portrait | Electorate | Term of office | |
|---|---|---|---|---|---|
| 1 |
Thomas Glassey (1844–1936) |

|
Bundamba |
August 1892 |
May 1893 |
| 274 days | |||||
| 2 |
John Hoolan (1842–1911) |

|
Burke |
May 1893 |
July 1894 |
| 1 year and 62 days | |||||
| (1) | Thomas Glassey (1844–1936) |
|
Bundamba |
July 1894 |
May 1899 |
| 4 years and 305 days | |||||
| 3 |
Anderson Dawson (1863–1910) |

|
Charters Towers |
May 1899 |
July 1900 |
| 1 year and 62 days | |||||
| 4 |
W. H. Browne (1846–1904) |

|
Croydon |
July 1900 |
October 1903 |
| 3 years and 93 days | |||||
| 5 |
Peter Airey (1865–1950) |

|
Flinders |
October 1903 |
April 1904 |
| 184 days | |||||
| 6 |
George Kerr (1853–1930) |

|
Barcoo |
April 1904 |
April 1907 |
| 3 years and 1 day | |||||
| 7 |
David Bowman (1860–1916) |
|
Fortitude Valley |
April 1907 |
9 September 1912 |
| 5 years and 162 days | |||||
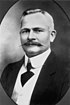
| 8 |
T. J. Ryan (1876–1921) |

|
Barcoo |
9 September 1912 |
22 October 1919 |
| 7 years and 44 days | |||||
| 9 |
Ted Theodore (1884–1950) |

|
Woothakata |
22 October 1919 |
26 February 1925 |
| 5 years and 128 days | |||||
| 10 |
William Gillies (1868–1928) |

|
Eacham |
26 February 1925 |
22 October 1925 |
| 239 days | |||||
| 11 |
William McCormack (1879–1947) |

|
Cairns |
22 October 1925 |
21 May 1929 |
| 3 years and 212 days | |||||
| 12 |
William Forgan Smith (1887–1953) |

|
Mackay |
27 May 1929 |
16 September 1942 |
| 13 years and 113 days | |||||
| 13 |
Frank Arthur Cooper (1872–1949) |

|
Bremer |
16 September 1942 |
7 March 1946 |
| 3 years and 173 days | |||||
| 14 |
Ned Hanlon (1887–1952) |

|
Ithaca |
7 March 1946 |
15 January 1952 |
| 5 years and 315 days | |||||
| 15 |
Vince Gair (1901–1980) |

|
South Brisbane |
17 January 1952 |
24 April 1957 |
| 5 years and 98 days | |||||
| 16 |
Jack Duggan (1910–1993) |

|
Toowoomba |
30 April 1957 |
3 August 1957 |
| 96 days | |||||
| 17 |
Les Wood (1907–1958) |

|
North Toowoomba |
28 August 1957 |
29 March 1958 |
| 214 days | |||||
| 18 |
Jim Donald (1895–1976) |

|
Ipswich East |
14 April 1958 |
17 August 1958 |
| 126 days | |||||
| (16) | Jack Duggan (1910–1993) |
|
Toowoomba West |
18 August 1958 |
11 October 1966 |
| 8 years and 55 days | |||||
| 19 |
Jack Houston (1919–2008) |

|
Bulimba |
11 October 1966 |
22 July 1974 |
| 7 years and 285 days | |||||
| 20 |
Perc Tucker (1919–1980) |

|
Townsville West |
22 July 1974 |
19 December 1974 |
| 151 days | |||||
| 21 |
Tom Burns (1931–2007) |
|
Lytton |
19 December 1974 |
28 November 1978 |
| 3 years and 345 days | |||||
| 22 |
Ed Casey (1933–2006) |
|
Mackay |
28 November 1978 |
20 October 1982 |
| 3 years and 327 days | |||||
| 23 |
Keith Wright (1942–2015) |
|
Rockhampton |
20 October 1982 |
29 August 1984 |
| 1 year and 315 days | |||||
| 24 |
Nev Warburton (1932–2018) |
|
Sandgate |
29 August 1984 |
2 March 1988 |
| 3 years and 187 days | |||||
| 25 |
Wayne Goss (1951–2014) |

|
Logan |
2 March 1988 |
19 February 1996 |
| 7 years and 355 days | |||||
| 26 |
Peter Beattie (b. 1952) |

|
Brisbane Central |
19 February 1996 |
12 September 2007 |
| 11 years and 206 days | |||||
| 27 |
Anna Bligh (b. 1960) |

|
South Brisbane |
12 September 2007 |
28 March 2012 |
| 4 years and 199 days | |||||
| 28 |
Annastacia Palaszczuk (b. 1969) |

|
Inala |
30 March 2012 |
15 December 2023 |
| 11 years and 261 days | |||||
| 29 |
Steven Miles (b. 1977) |

|
Murrumba |
15 December 2023 |
Incumbent |
| 47 days | |||||
Election results
State elections
| Election | Leader | Seats won | ± | Total votes | % | ±% | Position |
|---|---|---|---|---|---|---|---|
| 1893 | Thomas Glassey |
16 / 72
|
|
25,984 | 33.32% |
|
Opposition |
| 1896 |
20 / 72
|
|
28,581 | 34.97% |
|
Opposition | |
| 1899 |
21 / 72
|
|
33,756 | 35.47% |
|
Opposition | |
| 1902 | William Browne |
25 / 72
|
|
39,579 | 39.33% |
|
Opposition |
| 1904 | George Kerr |
34 / 72
|
|
28,961 | 36.05% |
|
Opposition |
| 1907 | David Bowman |
18 / 72
|
|
52,079 | 26.39% |
|
Opposition |
| 1908 |
22 / 72
|
|
55,771 | 29.80% |
|
Opposition | |
| 1909 |
27 / 72
|
|
77,712 | 36.85% |
|
Opposition | |
| 1912 |
25 / 72
|
|
100,878 | 46.70% |
|
Opposition | |
| 1915 | T. J. Ryan |
45 / 72
|
|
136,419 | 52.06% |
|
Majority government |
| 1918 |
48 / 72
|
|
180,709 | 53.68% |
|
Majority government | |
| 1920 | Ted Theodore |
38 / 72
|
|
168,455 | 47.77% |
|
Majority government |
| 1923 |
43 / 72
|
|
175,659 | 48.13% |
|
Majority government | |
| 1926 | William McCormack |
43 / 72
|
|
189,968 | 47.96% |
|
Majority government |
| 1929 |
27 / 72
|
|
173,242 | 40.16% |
|
Opposition | |
| 1932 | William Forgan Smith |
33 / 62
|
|
225,270 | 49.89% |
|
Majority government |
| 1935 |
46 / 62
|
|
247,135 | 53.43% |
|
Majority government | |
| 1938 |
44 / 62
|
|
250,943 | 47.17% |
|
Majority government | |
| 1941 |
41 / 62
|
|
267,206 | 51.41% |
|
Majority government | |
| 1944 | Frank Arthur Cooper |
37 / 62
|
|
224,888 | 44.67% |
|
Majority government |
| 1947 | Ned Hanlon |
35 / 62
|
|
272,103 | 43.58% |
|
Majority government |
| 1950 |
42 / 75
|
|
295,138 | 46.87% |
|
Majority government | |
| 1953 | Vince Gair |
50 / 75
|
|
323,882 | 53.21% |
|
Majority government |
| 1956 |
49 / 75
|
|
335,311 | 51.22% |
|
Majority government | |
| 1957 | Jack Duggan |
20 / 75
|
|
201,971 | 28.90% |
|
Opposition |
| 1960 |
25 / 78
|
|
296,430 | 39.89% |
|
Opposition | |
| 1963 |
26 / 78
|
|
337,928 | 43.83% |
|
Opposition | |
| 1966 |
26 / 78
|
|
350,254 | 43.84% |
|
Opposition | |
| 1969 | Jack Houston |
31 / 78
|
|
383,388 | 44.99% |
|
Opposition |
| 1972 |
33 / 82
|
|
424,002 | 46.75% |
|
Opposition | |
| 1974 | Perc Tucker |
11 / 82
|
|
376,187 | 36.03% |
|
Opposition |
| 1977 | Tom Burns |
23 / 82
|
|
466,021 | 42.83% |
|
Opposition |
| 1980 | Ed Casey |
25 / 82
|
|
487,493 | 41.49% |
|
Opposition |
| 1983 | Keith Wright |
32 / 82
|
|
579,363 | 43.98% |
|
Opposition |
| 1986 | Nev Warburton |
30 / 89
|
|
577,062 | 41.35% |
|
Opposition |
| 1989 | Wayne Goss |
54 / 89
|
|
792,466 | 50.32% |
|
Majority government |
| 1992 |
54 / 89
|
|
850,480 | 48.73% |
|
Majority government | |
| 1995 |
45 / 89
|
|
773,585 | 42.89% |
|
Majority government | |
| 1998 | Peter Beattie |
44 / 89
|
|
773,585 | 38.86% |
|
Minority government |
| 2001 |
66 / 89
|
|
1,007,737 | 48.93% |
|
Majority government | |
| 2004 |
63 / 89
|
|
1,011,630 | 47.01% |
|
Majority government | |
| 2006 |
59 / 89
|
|
1,032,617 | 46.92% |
|
Majority government | |
| 2009 | Anna Bligh |
51 / 89
|
|
1,002,415 | 42.25% |
|
Majority government |
| 2012 |
7 / 89
|
|
652,092 | 26.66% |
|
Opposition | |
| 2015 | Annastacia Palaszczuk |
44 / 89
|
|
983,054 | 37.47% |
|
Minority government |
| 2017 |
48 / 93
|
|
957,890 | 35.43% |
|
Majority government | |
| 2020 |
52 / 93
|
|
1,135,625 | 39.58% |
|
Majority government |
Federal elections
| Election | Seats Won | ± | Total Votes | % | ± | Leader |
|---|---|---|---|---|---|---|
| 1901 |
3 / 9
|
|
21,264 | 34.80% |
|
No leader |
| 1903 |
7 / 9
|
|
63,878 | 56.70% |
|
Chris Watson |
| 1906 |
4 / 9
|
|
51,231 | 43.00% |
|
|
| 1910 |
6 / 9
|
|
78,881 | 47.60% |
|
Andrew Fisher |
| 1913 |
7 / 10
|
|
149,447 | 54.80% |
|
|
| 1914 |
7 / 10
|
|
125,017 | 55.70% |
|
|
| 1917 |
4 / 10
|
|
160,448 | 48.70% |
|
Frank Tudor |
| 1919 |
3 / 10
|
|
149,588 | 46.80% |
|
|
| 1922 |
2 / 10
|
|
132,515 | 41.40% |
|
Matthew Charlton |
| 1925 |
1 / 10
|
|
152,778 | 42.40% |
|
|
| 1928 |
2 / 10
|
|
112,982 | 47.40% |
|
James Scullin |
| 1929 |
3 / 10
|
|
173,417 | 39.80% |
|
|
| 1931 |
5 / 10
|
|
141,443 | 39.30% |
|
|
| 1934 |
5 / 10
|
|
235,904 | 46.80% |
|
|
| 1937 |
5 / 10
|
|
233,612 | 43.00% |
|
John Curtin |
| 1940 |
6 / 10
|
|
255,063 | 46.10% |
|
|
| 1943 |
6 / 10
|
|
279,372 | 47.80% |
|
|
| 1946 |
5 / 10
|
|
256,370 | 43.10% |
|
Ben Chifley |
| 1949 |
3 / 18
|
|
255,036 | 39.50% |
|
|
| 1951 |
4 / 18
|
|
257,099 | 41.00% |
|
|
| 1954 |
5 / 18
|
|
295,424 | 42.50% |
|
H.V. Evatt |
| 1955 |
5 / 18
|
|
258,994 | 42.10% |
|
|
| 1958 |
3 / 18
|
|
270,676 | 37.50% |
|
|
| 1961 |
11 / 18
|
|
365,930 | 48.10% |
|
Arthur Calwell |
| 1963 |
8 / 18
|
|
369,570 | 46.30% |
|
|
| 1966 |
6 / 18
|
|
354,674 | 42.10% |
|
|
| 1969 |
7 / 18
|
|
430,403 | 48.20% |
|
Gough Whitlam |
| 1972 |
8 / 18
|
|
449,620 | 47.20% |
|
|
| 1974 |
6 / 18
|
|
476,710 | 44.00% |
|
|
| 1975 |
1 / 18
|
|
439,405 | 38.80% |
|
|
| 1977 |
3 / 19
|
|
443,221 | 37.70% |
|
|
| 1980 |
5 / 19
|
|
535,800 | 42.80% |
|
Bill Hayden |
| 1983 |
10 / 19
|
|
621,146 | 46.10% |
|
Bob Hawke |
| 1984 |
9 / 24
|
|
605,684 | 44.10% |
|
|
| 1987 |
13 / 24
|
|
683,640 | 45.00% |
|
|
| 1990 |
15 / 24
|
|
695,291 | 41.60% |
|
|
| 1993 |
13 / 25
|
|
739,862 | 40.50% |
|
Paul Keating |
| 1996 |
2 / 26
|
|
639,510 | 33.20% |
|
|
| 1998 |
8 / 27
|
|
719,743 | 36.10% |
|
Kim Beazley |
| 2001 |
7 / 27
|
|
730,914 | 34.70% |
|
|
| 2004 |
6 / 28
|
|
765,507 | 34.78% |
|
Mark Latham |
| 2007 |
15 / 29
|
|
1,020,665 | 42.91% |
|
Kevin Rudd |
| 2010 |
8 / 30
|
|
800,712 | 33.58% |
|
Julia Gillard |
| 2013 |
6 / 30
|
|
751,230 | 29.77% |
|
Kevin Rudd |
| 2016 |
8 / 30
|
|
825,627 | 30.91% |
|
Bill Shorten |
| 2019 |
6 / 30
|
|
754,792 | 26.68% |
|
|
| 2022 |
5 / 30
|
|
784,189 | 27.5% |
|
Anthony Albanese |