Otero County, Colorado
Otero County | |
|---|---|
 Otero County Courthouse in La Junta
| |
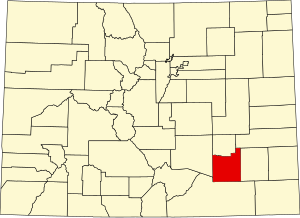 Location within the U.S. state of Colorado
| |
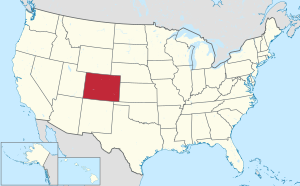 Colorado's location within the U.S.
| |
| Coordinates: 37°54′N 103°43′W | |
| Country | United States |
| State | Colorado |
| Founded | March 25, 1889 |
| Named for | Miguel Antonio Otero |
| Seat | La Junta |
| Largest city | La Junta |
| Area | |
| • Total | 1,270 sq mi (3,300 km2) |
| • Land | 1,262 sq mi (3,270 km2) |
| • Water | 7.7 sq mi (20 km2) 0.6% |
| Population
(2020)
| |
| • Total | 18,690 |
| • Density | 15/sq mi (6/km2) |
| Time zone | UTC−7 (Mountain) |
| • Summer (DST) | UTC−6 (MDT) |
| Congressional district | 3rd |
| Website | oterocounty |


Otero County is a county located in the U.S. state of Colorado. As of the 2020 census, the population was 18,690. The county seat is La Junta. The county was named for Miguel Antonio Otero, one of the founders of the town of La Junta and a member of a prominent Hispanic family.
Geography
According to the U.S. Census Bureau, the county has a total area of 1,270 square miles (3,300 km2), of which 1,262 square miles (3,270 km2) is land and 7.7 square miles (20 km2) (0.6%) is water.
Adjacent counties
- Crowley County - north
- Kiowa County - northeast
- Bent County - east
- Las Animas County - south
- Pueblo County - west
Major highways
-
 U.S. Highway 50
-
 U.S. Highway 350
-
 State Highway 10
-
 State Highway 71
-
 State Highway 109
-
 State Highway 167
-
 State Highway 207
-
 State Highway 266
National protected areas
Trails and byways
Demographics
| Census | Pop. | Note | %± |
|---|---|---|---|
| 1890 | 4,192 | — | |
| 1900 | 11,522 | 174.9% | |
| 1910 | 20,201 | 75.3% | |
| 1920 | 22,623 | 12.0% | |
| 1930 | 24,390 | 7.8% | |
| 1940 | 23,571 | −3.4% | |
| 1950 | 25,275 | 7.2% | |
| 1960 | 24,128 | −4.5% | |
| 1970 | 23,523 | −2.5% | |
| 1980 | 22,567 | −4.1% | |
| 1990 | 20,185 | −10.6% | |
| 2000 | 20,311 | 0.6% | |
| 2010 | 18,831 | −7.3% | |
| 2020 | 18,690 | −0.7% | |
| U.S. Decennial Census 1790-1960 1900-1990 1990-2000 2010-2020 | |||
At the 2000 census there were 20,311 people, 7,920 households, and 5,472 families living in the county. The population density was 16 people per square mile (6.2 people/km2). There were 8,813 housing units at an average density of 7 units per square mile (2.7 units/km2). The racial makeup of the county was 79.02% White, 0.76% Black or African American, 1.43% Native American, 0.70% Asian, 0.08% Pacific Islander, 15.06% from other races, and 2.96% from two or more races. 37.62% of the population were Hispanic or Latino of any race. Of the 7,920 households 32.20% had children under the age of 18 living with them, 52.70% were married couples living together, 12.00% had a female householder with no husband present, and 30.90% were non-families. 27.80% of households were one person and 12.90% were one person aged 65 or older. The average household size was 2.49 and the average family size was 3.04.
The age distribution was 26.90% under the age of 18, 8.90% from 18 to 24, 24.40% from 25 to 44, 23.40% from 45 to 64, and 16.50% 65 or older. The median age was 38 years. For every 100 females there were 95.60 males. For every 100 females age 18 and over, there were 91.50 males.
The median household income was $29,738 and the median family income was $35,906. Males had a median income of $26,996 versus $21,001 for females. The per capita income for the county was $15,113. About 14.20% of families and 18.80% of the population were below the poverty line, including 25.90% of those under age 18 and 11.80% of those age 65 or over.
Politics
Otero is a strongly Republican county, although less so than the counties of the Colorado High Plains. It was last won for the Democratic Party by Bill Clinton in 1996. Before that, Otero tended to be a Republican-leaning county at the Presidential level, although it did vote for Wilson twice, FDR in 1932 and 1936, Truman in 1948 and Lyndon Johnson in 1964.
| Year | Republican | Democratic | Third party | |||
|---|---|---|---|---|---|---|
| No. | % | No. | % | No. | % | |
| 2020 | 5,756 | 60.11% | 3,605 | 37.65% | 215 | 2.25% |
| 2016 | 4,928 | 58.31% | 2,943 | 34.82% | 581 | 6.87% |
| 2012 | 4,382 | 53.49% | 3,647 | 44.52% | 163 | 1.99% |
| 2008 | 4,393 | 54.47% | 3,547 | 43.98% | 125 | 1.55% |
| 2004 | 4,947 | 60.48% | 3,164 | 38.68% | 69 | 0.84% |
| 2000 | 4,082 | 55.83% | 2,963 | 40.52% | 267 | 3.65% |
| 1996 | 3,356 | 45.13% | 3,386 | 45.53% | 695 | 9.35% |
| 1992 | 3,120 | 37.53% | 3,485 | 41.92% | 1,708 | 20.55% |
| 1988 | 4,265 | 51.39% | 3,910 | 47.11% | 124 | 1.49% |
| 1984 | 5,373 | 62.37% | 3,005 | 34.88% | 237 | 2.75% |
| 1980 | 4,801 | 54.55% | 3,294 | 37.43% | 706 | 8.02% |
| 1976 | 4,597 | 51.54% | 4,118 | 46.17% | 205 | 2.30% |
| 1972 | 6,016 | 65.75% | 2,929 | 32.01% | 205 | 2.24% |
| 1968 | 4,690 | 49.66% | 3,891 | 41.20% | 864 | 9.15% |
| 1964 | 3,605 | 37.41% | 5,999 | 62.26% | 32 | 0.33% |
| 1960 | 6,015 | 58.80% | 4,199 | 41.05% | 15 | 0.15% |
| 1956 | 5,964 | 61.53% | 3,722 | 38.40% | 7 | 0.07% |
| 1952 | 6,552 | 63.57% | 3,721 | 36.10% | 34 | 0.33% |
| 1948 | 4,311 | 33.08% | 8,640 | 66.30% | 81 | 0.62% |
| 1944 | 5,002 | 56.74% | 3,791 | 43.00% | 23 | 0.26% |
| 1940 | 5,459 | 54.11% | 4,567 | 45.27% | 62 | 0.61% |
| 1936 | 3,859 | 39.49% | 5,775 | 59.10% | 138 | 1.41% |
| 1932 | 3,974 | 42.79% | 5,107 | 54.99% | 206 | 2.22% |
| 1928 | 5,788 | 74.88% | 1,876 | 24.27% | 66 | 0.85% |
| 1924 | 4,694 | 59.19% | 1,938 | 24.44% | 1,298 | 16.37% |
| 1920 | 3,846 | 55.93% | 2,727 | 39.66% | 303 | 4.41% |
| 1916 | 2,678 | 38.68% | 3,963 | 57.24% | 283 | 4.09% |
| 1912 | 1,293 | 20.98% | 2,885 | 46.80% | 1,986 | 32.22% |