Manchester Wythenshawe (UK Parliament constituency)
| Manchester Wythenshawe | |
|---|---|
| Former Borough constituency for the House of Commons | |
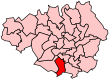 Manchester Wythenshawe in Greater Manchester, showing boundaries used from 1983-1997
| |
| County | Greater Manchester |
| 1950–1997 | |
| Seats | One |
| Created from | Manchester Withington |
| Replaced by | Wythenshawe and Sale East, |
Manchester Wythenshawe was a parliamentary constituency centred on the Wythenshawe suburb of Manchester. It returned one Member of Parliament (MP) to the House of Commons of the Parliament of the United Kingdom.
The constituency was created for the 1950 general election, and abolished for the 1997 general election. It was then replaced by the new Wythenshawe and Sale East constituency which joined it with the eastern half of Sale from the Trafford Metropolitan Borough.
Boundaries

1950–1955: The County Borough of Manchester wards of Didsbury and Wythenshawe.
1955–1974: The County Borough of Manchester wards of Baguley, Benchill, Didsbury, Northenden, and Woodhouse Park.
1974–1983: The County Borough of Manchester wards of Baguley, Benchill, Northenden, and Woodhouse Park.
1983–1997: The City of Manchester wards of Baguley, Benchill, Brooklands, Northenden, Sharston, and Woodhouse Park.
Members of Parliament
| Election | Member | Party | |
|---|---|---|---|
| 1950 | Eveline Hill | Conservative | |
| 1964 | Alf Morris | Labour | |
| 1997 | constituency abolished: see Wythenshawe and Sale East | ||
Elections
Elections in the 1950s
| Party | Candidate | Votes | % | ±% | |
|---|---|---|---|---|---|
| Conservative | Eveline Hill | 22,775 | 49.3 | ||
| Labour | Charles W Bridges | 17,191 | 37.2 | ||
| Liberal | Eric Noble | 5,607 | 12.2 | ||
| Communist | Frances Dean | 588 | 1.3 | ||
| Majority | 5,584 | 12.1 | |||
| Turnout | 46,161 | 84.2 | |||
| Conservative hold | Swing | ||||
| Party | Candidate | Votes | % | ±% | |
|---|---|---|---|---|---|
| Conservative | Eveline Hill | 28,611 | 56.5 | +7.2 | |
| Labour | Lewis L Hanbidge | 22,055 | 43.5 | +6.3 | |
| Majority | 6,556 | 13.0 | +0.9 | ||
| Turnout | 50,666 | 81.1 | -3.1 | ||
| Conservative hold | Swing | ||||
| Party | Candidate | Votes | % | ±% | |
|---|---|---|---|---|---|
| Conservative | Eveline Hill | 26,200 | 52.8 | -3.7 | |
| Labour | Norman Atkinson | 23,378 | 47.2 | +3.7 | |
| Majority | 2,882 | 5.6 | -7.4 | ||
| Turnout | 49,578 | 76.3 | -4.8 | ||
| Conservative hold | Swing | ||||
| Party | Candidate | Votes | % | ±% | |
|---|---|---|---|---|---|
| Conservative | Eveline Hill | 28,934 | 51.2 | -1.6 | |
| Labour Co-op | Alf Morris | 27,625 | 48.9 | +1.7 | |
| Majority | 1,309 | 2.3 | -3.3 | ||
| Turnout | 56,559 | 80.9 | +4.6 | ||
| Conservative hold | Swing | ||||
Elections in the 1960s
| Party | Candidate | Votes | % | ±% | |
|---|---|---|---|---|---|
| Labour Co-op | Alf Morris | 26,870 | 47.7 | -1.2 | |
| Conservative | Eveline Hill | 22,093 | 39.2 | -12.0 | |
| Liberal | Thomas N Armstrong | 7,336 | 13.0 | New | |
| Majority | 4,777 | 8.5 | N/A | ||
| Turnout | 56,299 | 79.6 | -1.3 | ||
| Labour Co-op gain from Conservative | Swing | ||||
| Party | Candidate | Votes | % | ±% | |
|---|---|---|---|---|---|
| Labour Co-op | Alf Morris | 27,485 | 53.1 | +5.4 | |
| Conservative | Frank Lofthouse | 18,548 | 35.8 | -3.4 | |
| Liberal | Thomas N Armstrong | 5,717 | 11.1 | -1.9 | |
| Majority | 8,937 | 17.3 | +8.8 | ||
| Turnout | 51,750 | 74.8 | -4.8 | ||
| Labour Co-op hold | Swing | ||||
Elections in the 1970s
| Party | Candidate | Votes | % | ±% | |
|---|---|---|---|---|---|
| Labour Co-op | Alf Morris | 30,260 | 55.3 | +2.2 | |
| Conservative | Henry Donald Moore | 24,505 | 44.8 | +9.0 | |
| Majority | 5,755 | 10.5 | -6.8 | ||
| Turnout | 54,765 | 70.2 | -4.6 | ||
| Labour Co-op hold | Swing | ||||
| Party | Candidate | Votes | % | ±% | |
|---|---|---|---|---|---|
| Labour Co-op | Alf Morris | 26,900 | 55.7 | +2.4 | |
| Conservative | Joyce Hill | 14,462 | 30.0 | -14.8 | |
| Liberal | Anthony Blonde | 6,905 | 14.3 | New | |
| Majority | 12,438 | 25.7 | +15.2 | ||
| Turnout | 48,267 | 75.0 | +4.8 | ||
| Labour Co-op hold | Swing | ||||
| Party | Candidate | Votes | % | ±% | |
|---|---|---|---|---|---|
| Labour Co-op | Alf Morris | 26,448 | 59.1 | +3.4 | |
| Conservative | Joyce Hill | 12,269 | 27.4 | -2.6 | |
| Liberal | RN Scott | 6,071 | 13.6 | -0.7 | |
| Majority | 14,179 | 31.7 | +6.0 | ||
| Turnout | 44,788 | 68.8 | -6.2 | ||
| Labour Co-op hold | Swing | ||||
| Party | Candidate | Votes | % | ±% | |
|---|---|---|---|---|---|
| Labour Co-op | Alf Morris | 26,860 | 59.1 | 0.0 | |
| Conservative | David Sumberg | 14,747 | 32.4 | +5.0 | |
| Liberal | Lee Griffiths | 3,853 | 8.5 | -5.1 | |
| Majority | 12,113 | 26.7 | -5.0 | ||
| Turnout | 45,460 | 75.0 | +6.2 | ||
| Labour Co-op hold | Swing | ||||
Elections in the 1980s
| Party | Candidate | Votes | % | ±% | |
|---|---|---|---|---|---|
| Labour Co-op | Alf Morris | 23,172 | 54.6 | ||
| Conservative | Joan Jacobs | 12,488 | 29.4 | ||
| Liberal | David J. Sandiford | 6,766 | 16.0 | ||
| Majority | 10,684 | 25.2 | |||
| Turnout | 42,426 | 69.6 | |||
| Labour Co-op hold | Swing | ||||
| Party | Candidate | Votes | % | ±% | |
|---|---|---|---|---|---|
| Labour Co-op | Alf Morris | 23,881 | 56.8 | +2.2 | |
| Conservative | David Sparrow | 12,026 | 28.6 | -0.8 | |
| SDP | Joan Butterworth | 5,921 | 14.1 | -1.9 | |
| Red Front | Susan Connelly | 216 | 0.5 | New | |
| Majority | 11,855 | 28.2 | +3.0 | ||
| Turnout | 42,044 | 72.1 | +2.5 | ||
| Labour Co-op hold | Swing | ||||
Elections in the 1990s
| Party | Candidate | Votes | % | ±% | |
|---|---|---|---|---|---|
| Labour Co-op | Alf Morris | 22,591 | 60.5 | +3.7 | |
| Conservative | Kevin A. McKenna | 10,595 | 28.4 | −0.2 | |
| Liberal Democrats | Stephen Fenn | 3,633 | 9.7 | −4.4 | |
| Green | Guy N. Otten | 362 | 1.0 | New | |
| Natural Law | Elspeth Martin | 133 | 0.4 | New | |
| Majority | 11,996 | 32.1 | +3.9 | ||
| Turnout | 37,314 | 69.7 | −2.4 | ||
| Labour Co-op hold | Swing | +2.0 | |||