List of communities in Alberta

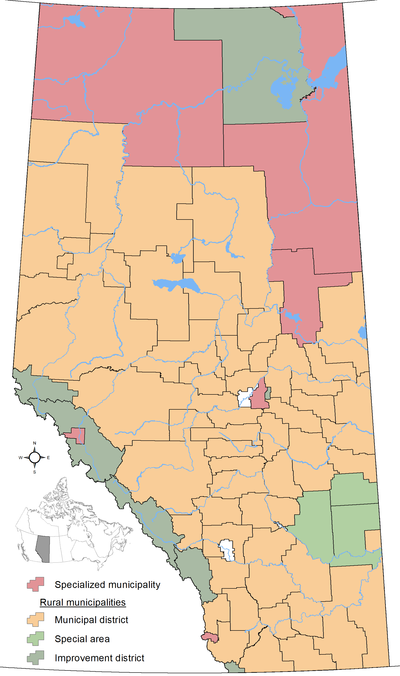
The province of Alberta, Canada, is divided into ten types of local governments – urban municipalities (including cities, towns, villages and summer villages), specialized municipalities, rural municipalities (including municipal districts (often named as counties), improvement districts, and special areas), Métis settlements, and Indian reserves. All types of municipalities are governed by local residents and were incorporated under various provincial acts, with the exception of improvement districts (governed by either the provincial or federal government), and Alberta's Indian reserves (governed by local band governments under federal jurisdiction).
Alberta also has numerous unincorporated communities (including urban service areas, hamlets and a townsite) that are not independent municipalities in their own right. However, they are all recognized as sub-municipal entities by Ministry of Municipal Affairs under the jurisdiction of specialized municipalities or rural municipalities, with the exception of the lone townsite (its jurisdiction is shared with an Indian reserve that surrounds it).
With the exception of Métis settlements, Statistics Canada recognizes all of Alberta's municipalities as census subdivisions and groups them into 19 census divisions based on geography. Within census divisions, Statistics Canada groups some of Alberta's municipalities/census subdivisions into two census metropolitan areas (CMAs) or 12 census agglomerations (CAs) for enumeration purposes. All CMAs include large urban centres and surrounding census subdivisions. All CAs also include large urban centres and in some cases their surrounding census subdivisions.
With the exception of Indian reserves, the administration of municipalities in Alberta is regulated by the Municipal Government Act, the Special Areas Act and the Metis Settlements Act.
As of 2019, the combined unofficial population of all of Alberta's municipalities was 4,271,759.
Municipalities
Urban municipalities
Cities
According to Section 82 of the Municipal Government Act (MGA), an area may incorporate as a city if:
- it has a population of 10,000 people or more; and
- the majority of its buildings are on parcels of land smaller than 1,850 m2 (19,900 sq ft).
Essentially, cities are formed from urban communities with populations of at least 10,000 people.
Alberta currently has a total of 19 cities with a combined population totalling 2,959,559 as of 2019.
| Name | Region | Incorporation date (city) |
Council size |
2021 Census of Population | ||||
|---|---|---|---|---|---|---|---|---|
| Population (2021) |
Population (2016) |
Change (%) |
Land area (km2) |
Population density (per km2) |
||||
| Airdrie | Calgary Metro | Jan 1, 1985 | 7 | 74,100 | 61,581 | +20.3% | 84.39 | 878.1 |
| Beaumont | Edmonton Metro | Jan 1, 2019 | 7 | 20,888 | 17,457 | +19.7% | 24.70 | 845.7 |
| Brooks | Southern | Sep 1, 2005 | 7 | 14,924 | 14,451 | +3.3% | 18.21 | 819.5 |
| Calgary | Calgary Metro | Jan 1, 1894 | 15 | 1,306,784 | 1,239,220 | +5.5% | 820.62 | 1,592.4 |
| Camrose | Central | Jan 1, 1955 | 9 | 18,772 | 18,742 | +0.2% | 41.67 | 450.5 |
| Chestermere | Calgary Metro | Jan 1, 2015 | 7 | 22,163 | 19,887 | +11.4% | 32.83 | 675.1 |
| Cold Lake | North | Oct 1, 2000 | 7 | 15,661 | 14,976 | +4.6% | 66.61 | 235.1 |
| Edmonton | Edmonton Metro | Oct 8, 1904 | 13 | 1,010,899 | 933,088 | +8.3% | 765.61 | 1,320.4 |
| Fort Saskatchewan | Edmonton Metro | Jul 1, 1985 | 7 | 27,088 | 24,169 | +12.1% | 56.50 | 479.4 |
| Grande Prairie | Northern | Jan 1, 1958 | 9 | 64,141 | 63,166 | +1.5% | 132.71 | 483.3 |
| Lacombe | Central | Sep 5, 2010 | 7 | 13,396 | 13,057 | +2.6% | 20.59 | 650.6 |
| Leduc | Edmonton Metro | Sep 1, 1983 | 7 | 34,094 | 29,993 | +13.7% | 42.25 | 807.0 |
| Lethbridge | Southern | May 9, 1906 | 9 | 98,406 | 92,729 | +6.1% | 121.12 | 812.5 |
| Lloydminster (part) | Central | Jan 1, 1958 | 7 | 19,739 | 19,645 | +0.5% | 23.98 | 823.1 |
| Medicine Hat | Southern | May 9, 1906 | 9 | 63,271 | 63,260 | 0.0% | 111.97 | 565.1 |
| Red Deer | Central | Mar 25, 1913 | 9 | 100,844 | 100,418 | +0.4% | 104.34 | 966.5 |
| Spruce Grove | Edmonton Metro | Mar 1, 1986 | 7 | 37,645 | 34,108 | +10.4% | 37.52 | 1,003.3 |
| St. Albert | Edmonton Metro | Jan 1, 1977 | 7 | 68,232 | 65,589 | +4.0% | 47.84 | 1,426.3 |
| Wetaskiwin | Central | May 9, 1906 | 7 | 12,594 | 12,655 | −0.5% | 18.75 | 671.7 |
| Total cities | — | — | 157 | 3,023,641 | 2,838,191 | +6.5% | 2,572.21 | 1,175.5 |
Towns
According to Section 81 of the Municipal Government Act (MGA), an area may incorporate as a town if:
- it has a population of 1,000 people or more; and
- the majority of its buildings are on parcels of land smaller than 1,850 m2 (19,900 sq ft).
Essentially, towns are formed from urban communities with populations of at least 1,000 people. When a town's population exceeds 10,000 people, its council may apply to change its status to that of a city, but the change in incorporated status is not mandatory.
Communities with shrinking populations are allowed to retain town status even if the number of residents falls below the 1,000 limit. Some of Alberta's towns have never reached a population of 1,000 people, but were incorporated as towns before the current requirement to have a population of 1,000 or more.
Alberta currently has a total of 107 towns, with a combined population totalling 466,470 as of 2019.
| Name |
Specialized/rural municipality |
Incorporation date (town) |
Municipal census population (year) |
Population (2016) |
Population (2011) |
Change (%) |
Land area (km2) |
Population density (per km2) |
|---|---|---|---|---|---|---|---|---|
| Athabasca | Athabasca County | Sep 19, 1911 | 2,965 | 2,990 | −0.8% | 17.65 | 168.0 | |
| Banff | Improvement District No. 9 (Banff) | Jan 1, 1990 |
8,875 (2017) |
7,851 | 7,584 | +3.5% | 4.77 | 1,645.9 |
| Barrhead | Barrhead No. 11, County of | Nov 26, 1946 | 4,579 | 4,432 | +3.3% | 8.17 | 560.5 | |
| Bashaw | Camrose County | May 1, 1964 | 830 | 873 | −4.9% | 2.99 | 277.6 | |
| Bassano | Newell, County of | Jan 16, 1911 | 1,206 | 1,282 | −5.9% | 5.22 | 231.0 | |
| Beaverlodge | Grande Prairie No. 1, County of | Jan 24, 1956 | 2,465 | 2,365 | +4.2% | 5.73 | 430.2 | |
| Bentley | Lacombe County | Jan 1, 2001 | 1,078 | 1,073 | +0.5% | 2.24 | 481.3 | |
| Blackfalds | Lacombe County | Apr 1, 1980 |
10,125 (2018) |
9,328 | 6,300 | +48.1% | 16.44 | 567.4 |
| Bon Accord | Sturgeon County | Nov 20, 1979 | 1,529 | 1,488 | +2.8% | 2.13 | 717.8 | |
| Bonnyville | Bonnyville No. 87, M.D. of | Feb 3, 1948 |
6,422 (2017) |
5,975 | 6,216 | −3.9% | 14.18 | 421.4 |
| Bow Island | Forty Mile No. 8, County of | Feb 1, 1912 |
2,043 (2017) |
1,983 | 2,025 | −2.1% | 5.81 | 341.3 |
| Bowden | Red Deer County | Sep 1, 1981 | 1,240 | 1,241 | −0.1% | 2.8 | 442.9 | |
| Bruderheim | Lamont County | Sep 17, 1980 |
1,395 (2018) |
1,308 | 1,155 | +13.2% | 7.12 | 183.7 |
| Calmar | Leduc County | Jan 19, 1954 | 2,228 | 1,970 | +13.1% | 4.68 | 476.1 | |
| Canmore |
Bighorn No. 8, M.D. of Kananaskis Improvement District |
Jun 1, 1966 | 13,992 | 12,288 | +13.9% | 69.43 | 201.5 | |
| Cardston | Cardston County | Jul 2, 1901 |
3,909 (2018) |
3,585 | 3,580 | +0.1% | 8.59 | 417.3 |
| Carstairs | Mountain View County | Sep 1, 1966 | 4,077 | 3,442 | +18.4% | 11.92 | 342.0 | |
| Castor | Paintearth No. 18, County of | Jun 27, 1910 | 929 | 932 | −0.3% | 2.63 | 353.2 | |
| Claresholm | Willow Creek No. 26, M.D. of | Aug 31, 1905 | 3,780 | 3,758 | +0.6% | 8.11 | 466.1 | |
| Coaldale | Lethbridge County | Jan 7, 1952 |
8,691 (2019) |
8,215 | 7,493 | +9.6% | 7.99 | 1,028.2 |
| Coalhurst | Lethbridge County | Jun 1, 1995 |
2,784 (2019) |
2,668 | 1,978 | +34.9% | 3.11 | 857.9 |
| Cochrane | Rocky View County | Feb 15, 1971 |
29,277 (2019) |
25,853 | 17,580 | +47.1% | 29.83 | 866.7 |
| Coronation | Paintearth No. 18, County of | Apr 29, 1912 | 940 | 947 | −0.7% | 3.62 | 259.7 | |
| Crossfield | Rocky View County | Aug 1, 1980 |
3,308 (2018) |
2,983 | 2,853 | +4.6% | 11.96 | 249.4 |
| Daysland | Flagstaff County | Apr 2, 1907 | 824 | 807 | +2.1% | 1.75 | 470.9 | |
| Devon | Leduc County | Feb 24, 1950 | 6,578 | 6,515 | +1.0% | 14.3 | 460.0 | |
| Diamond Valley | Foothills County | Jan 1, 2023 | 5,259 | 4,540 | +15.8% | 9.63 | 546.1 | |
| Didsbury | Mountain View County | Sep 27, 1906 | 5,268 | 4,957 | +6.3% | 16.37 | 321.8 | |
| Drayton Valley | Brazeau County | Feb 1, 1957 | 7,235 | 7,118 | +1.6% | 30.72 | 235.5 | |
| Drumheller |
Kneehill County Special Area No. 2 Starland County Wheatland County |
Mar 2, 1916 January 1, 1998 |
7,982 | 8,029 | −0.6% | 108.03 | 73.9 | |
| Eckville | Lacombe County | Jul 1, 1966 |
1,163 (2018) |
1,125 | 1,125 | 0.0% | 1.6 | 703.1 |
| Edson | Yellowhead County | Sep 21, 1911 | 8,414 | 8,475 | −0.7% | 29.72 | 283.1 | |
| Elk Point | St. Paul No. 19, County of | Jan 1, 1962 | 1,452 | 1,412 | +2.8% | 4.91 | 295.7 | |
| Fairview | Fairview No. 136, M.D. of | Apr 25, 1949 | 2,998 | 3,162 | −5.2% | 11.36 | 263.9 | |
| Falher | Smoky River No. 130, M.D. of | Jan 1, 1955 | 1,047 | 1,075 | −2.6% | 2.78 | 376.6 | |
| Fort Macleod | Willow Creek No. 26, M.D. of | Mar 29, 1912 | 2,967 | 3,117 | −4.8% | 23.41 | 126.7 | |
| Fox Creek | Greenview No. 16, M.D. of | Sep 1, 1983 | 1,971 | 1,969 | +0.1% | 12.36 | 159.5 | |
| Gibbons | Sturgeon County | Apr 1, 1977 | 3,159 | 3,030 | +4.3% | 7.5 | 421.2 | |
| Grimshaw | Peace No. 135, M.D. of | Feb 2, 1953 | 2,718 | 2,515 | +8.1% | 7.09 | 383.4 | |
| Hanna | Special Area No. 2 | Apr 14, 1914 | 2,559 | 2,673 | −4.3% | 8.81 | 290.5 | |
| Hardisty | Flagstaff County | Nov 9, 1910 | 554 | 639 | −13.3% | 5.13 | 108.0 | |
| High Level | Mackenzie County | Sep 1, 1983 |
3,992 (2017) |
3,159 | 3,641 | −13.2% | 29.2 | 108.2 |
| High Prairie | Big Lakes County | Jan 10, 1950 | 2,564 | 2,600 | −1.4% | 7.22 | 355.1 | |
| High River | Foothills No. 31, M.D. of | Feb 12, 1906 | 13,584 | 12,930 | +5.1% | 21.39 | 635.1 | |
| Hinton | Yellowhead County | Dec 29, 1958 | 9,882 | 9,640 | +2.5% | 33.52 | 294.8 | |
| Innisfail | Red Deer County | Nov 20, 1903 | 7,847 | 7,876 | −0.4% | 19.4 | 404.5 | |
| Irricana | Rocky View County | Jun 9, 2005 | 1,216 | 1,162 | +4.6% | 3.23 | 376.5 | |
| Killam | Flagstaff County | May 1, 1965 | 989 | 981 | +0.8% | 6.75 | 146.5 | |
| Lamont | Lamont County | May 31, 1968 | 1,774 | 1,753 | +1.2% | 9.2 | 192.8 | |
| Legal | Sturgeon County | Jan 1, 1998 | 1,345 | 1,225 | +9.8% | 3.18 | 423.0 | |
| Magrath | Cardston County | Jul 24, 1907 |
2,435 (2017) |
2,374 | 2,217 | +7.1% | 5.99 | 396.3 |
| Manning | Northern Lights, County of | Jan 1, 1957 | 1,183 | 1,164 | +1.6% | 4.05 | 292.1 | |
| Mayerthorpe | Lac Ste. Anne County | Mar 20, 1961 | 1,320 | 1,398 | −5.6% | 4.37 | 302.1 | |
| McLennan | Smoky River No. 130, M.D. of | Feb 11, 1948 |
791 (2017) |
701 | 809 | −13.3% | 3.71 | 188.9 |
| Milk River | Warner No. 5, County of | Feb 7, 1956 | 827 | 811 | +2.0% | 2.33 | 354.9 | |
| Millet | Wetaskiwin No. 10, County of | Sep 1, 1983 | 1,945 | 2,092 | −7.0% | 3.72 | 522.8 | |
| Morinville | Sturgeon County | Apr 21, 1911 |
9,893 (2016) |
9,848 | 8,569 | +14.9% | 11.15 | 883.2 |
| Mundare | Lamont County | Jan 4, 1951 | 852 | 855 | −0.4% | 4.21 | 202.4 | |
| Nanton | Willow Creek No. 26, M.D. of | Aug 9, 1907 | 2,181 | 2,132 | +2.3% | 4.87 | 447.8 | |
| Nobleford | Lethbridge County | Feb 28, 2018 | 1,278 | 1,000 | +27.8% | 1.59 | 803.8 | |
| Okotoks | Foothills No. 31, M.D. of | Jun 1, 1904 |
29,002 (2018) |
28,881 | 24,511 | +17.8% | 19.63 | 1,471.3 |
| Olds | Mountain View County | Jul 1, 1905 | 9,184 | 8,235 | +11.5% | 14.93 | 615.1 | |
| Onoway | Lac Ste. Anne County | Sep 1, 2005 | 1,029 | 1,039 | −1.0% | 3.32 | 309.9 | |
| Oyen | Special Area No. 3 | Sep 1, 1965 |
1,022 (2017) |
1,001 | 973 | +2.9% | 5.28 | 189.6 |
| Peace River |
Northern Lights, County of Northern Sunrise County Peace No. 135, M.D. of |
Dec 1, 1919 | 6,842 | 6,729 | +1.7% | 26.26 | 260.5 | |
| Penhold | Red Deer County | Sep 1, 1980 | 3,277 | 2,375 | +38.0% | 5.29 | 619.5 | |
| Picture Butte | Lethbridge County | Jan 1, 1960 | 1,810 | 1,650 | +9.7% | 2.85 | 635.1 | |
| Pincher Creek | Pincher Creek No. 9, M.D. of | May 12, 1906 | 3,642 | 3,685 | −1.2% | 10.09 | 361.0 | |
| Ponoka | Ponoka County | Oct 15, 1904 | 7,229 | 6,778 | +6.7% | 17.33 | 417.1 | |
| Provost | Provost No. 52, M.D. of | Dec 29, 1952 | 1,998 | 2,041 | −2.1% | 4.72 | 423.3 | |
| Rainbow Lake | Mackenzie County | Sep 1, 1995 | 795 | 870 | −8.6% | 10.76 | 73.9 | |
| Raymond | Warner No. 5, County of | Jul 1, 1903 |
4,252 (2018) |
3,708 | 3,743 | −0.9% | 6.66 | 556.8 |
| Redcliff | Cypress County | Aug 5, 1912 | 5,600 | 5,588 | +0.2% | 16.25 | 344.6 | |
| Redwater | Sturgeon County | Dec 31, 1950 | 2,053 | 1,915 | +7.2% | 20.03 | 102.5 | |
| Rimbey | Ponoka County | Dec 13, 1948 | 2,567 | 2,378 | +7.9% | 11.4 | 225.2 | |
| Rocky Mountain House | Clearwater County | Aug 31, 1939 | 6,635 | 6,933 | −4.3% | 12.71 | 522.0 | |
| Sedgewick | Flagstaff County | May 1, 1966 | 811 | 857 | −5.4% | 2.72 | 298.2 | |
| Sexsmith | Grande Prairie No. 1, County of | Oct 15, 1979 | 2,620 | 2,418 | +8.4% | 13.24 | 197.9 | |
| Slave Lake | Lesser Slave River No. 124, M.D. of | Aug 2, 1965 | 6,651 | 6,782 | −1.9% | 14.44 | 460.6 | |
| Smoky Lake | Smoky Lake County | Feb 1, 1962 | 964 | 1,022 | −5.7% | 4.26 | 226.3 | |
| Spirit River | Spirit River No. 133, M.D. of | Sep 18, 1951 | 995 | 1,025 | −2.9% | 3.14 | 316.9 | |
| St. Paul | St. Paul No. 19, County of | Dec 15, 1936 |
5,963 (2017) |
5,827 | 5,405 | +7.8% | 8.64 | 674.4 |
| Stavely | Willow Creek No. 26, M.D. of | May 25, 1912 | 541 | 505 | +7.1% | 1.83 | 295.6 | |
| Stettler | Stettler No. 6, County of | Nov 23, 1906 | 5,952 | 5,748 | +3.5% | 13.14 | 453.0 | |
| Stony Plain | Parkland County | Dec 10, 1908 |
17,842 (2019) |
17,189 | 15,051 | +14.2% | 35.72 | 481.2 |
| Strathmore | Wheatland County | Jul 6, 1911 |
13,528 (2018) |
13,756 | 12,305 | +11.8% | 27.4 | 502.0 |
| Sundre | Mountain View County | Jan 1, 1956 | 2,729 | 2,610 | +4.6% | 11.11 | 245.6 | |
| Swan Hills | Big Lakes County | Jan 1, 1967 | 1,301 | 1,465 | −11.2% | 26.12 | 49.8 | |
| Sylvan Lake | Red Deer County | May 20, 1946 | 14,816 | 12,362 | +19.9% | 23.36 | 634.2 | |
| Taber | Taber, M.D. of | Jul 1, 1907 | 8,428 | 8,104 | +4.0% | 15.67 | 537.8 | |
| Thorsby | Leduc County | Jan 1, 2017 |
1,015 (2017) |
985 | 951 | +3.6% | 3.85 | 255.8 |
| Three Hills | Kneehill County | Jan 1, 1929 | 3,212 | 3,198 | +0.4% | 6.75 | 475.9 | |
| Tofield | Beaver County | Sep 10, 1909 | 2,081 | 2,182 | −4.6% | 8.21 | 253.5 | |
| Trochu | Kneehill County | Aug 1, 1962 | 1,058 | 1,072 | −1.3% | 2.78 | 380.6 | |
| Two Hills | Two Hills No. 21, County of | Jan 1, 1955 |
1,443 (2017) |
1,352 | 1,379 | −2.0% | 3.38 | 400.0 |
| Valleyview | Greenview No. 16, M.D. of | Feb 5, 1957 | 1,863 | 1,761 | +5.8% | 9.32 | 199.9 | |
| Vauxhall | Taber, M.D. of | Jan 1, 1961 | 1,222 | 1,288 | −5.1% | 2.72 | 449.3 | |
| Vegreville | Minburn No. 27, County of | Aug 15, 1906 | 5,708 | 5,717 | −0.2% | 14.08 | 405.4 | |
| Vermilion | Vermilion River, County of | Aug 27, 1906 |
4,150 (2017) |
4,084 | 3,930 | +3.9% | 12.93 | 315.9 |
| Viking | Beaver County | Nov 10, 1952 | 1,083 | 1,041 | +4.0% | 3.7 | 292.7 | |
| Vulcan | Vulcan County | Jun 15, 1921 | 1,917 | 1,836 | +4.4% | 6.34 | 302.4 | |
| Wainwright | Wainwright No. 61, M.D. of | Jul 14, 1910 | 6,270 | 5,925 | +5.8% | 9.1 | 689.0 | |
| Wembley | Grande Prairie No. 1, County of | Aug 1, 1980 | 1,516 | 1,383 | +9.6% | 4.75 | 319.2 | |
| Westlock | Westlock County | Jan 7, 1947 | 5,101 | 4,823 | +5.8% | 13.37 | 381.5 | |
| Whitecourt | Woodlands County | Dec 20, 1971 | 10,204 | 9,605 | +6.2% | 26.44 | 385.9 | |
| Total towns | — | — | — | 454,181 | 420,498 | +8.0% | 1,248.01 | 363.9 |
Villages
According to Section 80 of the Municipal Government Act (MGA), an area may incorporate as a village if:
- it has a population of 300 people or more; and
- the majority of its buildings are on parcels of land smaller than 1,850 m2 (19,900 sq ft).
Essentially, villages are formed from urban communities with populations of at least 300 people. When a village's population exceeds 1,000 people, its council may apply to change its status to that of a town, but the change in incorporated status is not mandatory.
Communities with shrinking populations are allowed to retain village status even if the number of residents falls below the 300 limit. Some of Alberta's villages have never reached a population of 300 people, but were incorporated as villages before there was a requirement to have a population of 300 or more.
Alberta currently has a total of 81 villages, with a combined population totalling 34,600 as of 2021.
| Name |
Rural municipality |
Incorporation date (village)--> |
Population (2016) |
Population (2011) |
Change (%) |
Land area (km²) |
Population density (per km²) |
|---|---|---|---|---|---|---|---|
| Acme | Kneehill County | July 7, 1910 | 653 | 653 | 0.0% | 2.48 | 263.3/km2 |
| Alberta Beach | Lac Ste. Anne County | January 1, 1999 | 1,018 | 865 | +17.7% | 2.01 | 506.5/km2 |
| Alix | Lacombe County | June 3, 1907 | 734 | 830 | −11.6% | 3.13 | 234.5/km2 |
| Alliance | Flagstaff County | August 26, 1918 | 154 | 174 | −11.5% | 0.51 | 302.0/km2 |
| Amisk | Provost No. 52, MD of | January 1, 1956 | 204 | 207 | −1.4% | 0.76 | 268.4/km2 |
| Andrew | Lamont County | June 24, 1930 | 425 | 379 | +12.1% | 1.17 | 363.2/km2 |
| Arrowwood | Vulcan County | May 13, 1926 | 207 | 188 | +10.1% | 0.75 | 276.0/km2 |
| Barnwell | Taber, MD of | January 1, 1980 | 947 | 771 | +22.8% | 1.51 | 627.2/km2 |
| Barons | Lethbridge County | May 6, 1910 | 341 | 315 | +8.3% | 0.81 | 421.0/km2 |
| Bawlf | Camrose County | October 12, 1906 | 422 | 403 | +4.7% | 0.89 | 474.2/km2 |
| Beiseker | Rocky View County | February 23, 1921 | 819 | 785 | +4.3% | 2.85 | 287.4/km2 |
| Berwyn | Peace No. 135, MD of | November 28, 1936 | 538 | 526 | +2.3% | 1.58 | 340.5/km2 |
| Big Valley | Stettler No. 6, County of | March 9, 1942 | 346 | 364 | −4.9% | 1.86 | 186.0/km2 |
| Bittern Lake | Camrose County | November 2, 1904 | 220 | 224 | −1.8% | 6.57 | 33.5/km2 |
| Boyle | Athabasca County | December 31, 1953 | 845 | 916 | −7.8% | 7.13 | 118.5/km2 |
| Breton | Brazeau County | January 1, 1957 | 574 | 496 | +15.7% | 1.72 | 333.7/km2 |
| Carbon | Kneehill County | November 18, 1912 | 454 | 592 | −23.3% | 1.99 | 228.1/km2 |
| Carmangay | Vulcan County | March 4, 1936 | 242 | 367 | −34.1% | 1.86 | 130.1/km2 |
| Caroline | Clearwater County | December 31, 1951 | 512 | 501 | +2.2% | 2.04 | 251.0/km2 |
| Champion | Vulcan County | May 27, 1911 | 317 | 378 | −16.1% | 0.89 | 356.2/km2 |
| Chauvin | Wainwright No. 61, MD of | December 30, 1912 | 335 | 334 | +0.3% | 2.24 | 149.6/km2 |
| Chipman | Lamont County | October 21, 1913 | 274 | 284 | −3.5% | 9.61 | 28.5/km2 |
| Clive | Lacombe County | January 9, 1912 | 715 | 675 | +5.9% | 2.17 | 329.5/km2 |
| Clyde | Westlock County | January 28, 1914 | 430 | 503 | −14.5% | 1.31 | 328.2/km2 |
| Consort | Special Area No. 4 | September 23, 1912 | 729 | 689 | +5.8% | 3.05 | 239.0/km2 |
| Coutts | Warner No. 5, County of | January 1, 1960 | 245 | 277 | −11.6% | 1.24 | 197.6/km2 |
| Cowley | Pincher Creek No. 9, MD of | August 16, 1906 | 209 | 236 | −11.4% | 1.37 | 152.6/km2 |
| Cremona | Mountain View County | January 1, 1955 | 444 | 457 | −2.8% | 1.94 | 228.9/km2 |
| Czar | Provost No. 52, MD of | November 12, 1917 | 202 | 167 | +21.0% | 1.12 | 180.4/km2 |
| Delburne | Red Deer County | January 17, 1913 | 892 | 830 | +7.5% | 3.98 | 224.1/km2 |
| Delia | Starland County | July 20, 1914 | 216 | 186 | +16.1% | 1.33 | 162.4/km2 |
| Donalda | Stettler No. 6, County of | December 30, 1912 | 219 | 259 | −15.4% | 0.99 | 221.2/km2 |
| Donnelly | Smoky River No. 130, MD of | January 1, 1956 | 342 | 305 | +12.1% | 1.31 | 261.1/km2 |
| Duchess | Newell, County of | May 12, 1921 | 1,085 | 992 | +9.4% | 1.96 | 553.6/km2 |
| Edberg | Camrose County | February 4, 1930 | 151 | 168 | −10.1% | 0.35 | 431.4/km2 |
| Edgerton | Wainwright No. 61, MD of | September 11, 1917 | 384 | 317 | +21.1% | 2.04 | 188.2/km2 |
| Elnora | Red Deer County | July 22, 1929 | 298 | 313 | −4.8% | 1.47 | 202.7/km2 |
| Empress | Special Area No. 2 | February 5, 1914 | 135 | 188 | −28.2% | 1.58 | 85.4/km2 |
| Foremost | Forty Mile No. 8, County of | December 31, 1950 | 541 | 526 | +2.9% | 2.16 | 250.5/km2 |
| Forestburg | Flagstaff County | August 21, 1919 | 875 | 831 | +5.3% | 2.73 | 320.5/km2 |
| Girouxville | Smoky River No. 130, MD of | December 31, 1951 | 219 | 266 | −17.7% | 0.67 | 326.9/km2 |
| Glendon | Bonnyville No. 87, MD of | January 1, 1956 | 493 | 486 | +1.4% | 1.99 | 247.7/km2 |
| Glenwood | Cardston County | January 1, 1961 | 316 | 287 | +10.1% | 1.37 | 230.7/km2 |
| Halkirk | Paintearth No. 18, County of | February 10, 1912 | 112 | 121 | −7.4% | 0.61 | 183.6/km2 |
| Hay Lakes | Camrose County | April 17, 1928 | 495 | 425 | +16.5% | 0.59 | 839.0/km2 |
| Heisler | Flagstaff County | January 1, 1961 | 160 | 151 | +6.0% | 0.64 | 250.0/km2 |
| Hill Spring | Cardston County | January 1, 1961 | 162 | 186 | −12.9% | 0.96 | 168.8/km2 |
| Hines Creek | Clear Hills County | December 31, 1951 | 346 | 380 | −8.9% | 5.33 | 64.9/km2 |
| Holden | Beaver County | April 14, 1909 | 350 | 381 | −8.1% | 1.74 | 201.1/km2 |
| Hughenden | Provost No. 52, MD of | December 27, 1917 | 243 | 230 | +5.7% | 0.78 | 311.5/km2 |
| Hussar | Wheatland County | April 20, 1928 | 190 | 176 | +8.0% | 0.75 | 253.3/km2 |
| Innisfree | Minburn No. 27, County of | March 11, 1911 | 193 | 220 | −12.3% | 1.01 | 191.1/km2 |
| Irma | Wainwright No. 61, MD of | May 30, 1912 | 521 | 457 | +14.0% | 1.34 | 388.8/km2 |
| Kitscoty | Vermilion River, County of | March 22, 1911 | 925 | 846 | +9.3% | 1.51 | 612.6/km2 |
| Linden | Kneehill County | January 1, 1964 | 828 | 725 | +14.2% | 2.58 | 320.9/km2 |
| Lomond | Vulcan County | February 16, 1916 | 166 | 173 | −4.0% | 1.21 | 137.2/km2 |
| Longview | Foothills County | January 1, 1964 | 307 | 307 | 0.0% | 1.1 | 279.1/km2 |
| Lougheed | Flagstaff County | November 7, 1911 | 256 | 233 | +9.9% | 2.1 | 121.9/km2 |
| Mannville | Minburn No. 27, County of | December 29, 1906 | 828 | 803 | +3.1% | 1.64 | 504.9/km2 |
| Marwayne | Vermilion River, County of | December 31, 1952 | 564 | 612 | −7.8% | 1.6 | 352.5/km2 |
| Milo | Vulcan County | May 7, 1931 | 91 | 122 | −25.4% | 0.98 | 92.9/km2 |
| Morrin | Starland County | April 16, 1920 | 240 | 245 | −2.0% | 0.67 | 358.2/km2 |
| Munson | Starland County | May 5, 1911 | 192 | 204 | −5.9% | 2.53 | 75.9/km2 |
| Myrnam | Two Hills No. 21, County of | August 22, 1930 | 339 | 370 | −8.4% | 2.79 | 121.5/km2 |
| Nampa | Northern Sunrise County | January 1, 1958 | 364 | 362 | +0.6% | 1.71 | 212.9/km2 |
| Paradise Valley | Vermilion River, County of | January 1, 1964 | 179 | 174 | +2.9% | 0.63 | 284.1/km2 |
| Rockyford | Wheatland County | March 28, 1919 | 316 | 325 | −2.8% | 1.08 | 292.6/km2 |
| Rosalind | Camrose County | January 1, 1966 | 188 | 190 | −1.1% | 0.62 | 303.2/km2 |
| Rosemary | Newell, County of | December 31, 1951 | 396 | 342 | +15.8% | 0.59 | 671.2/km2 |
| Rycroft | Spirit River No. 133, MD of | March 15, 1944 | 612 | 628 | −2.5% | 1.92 | 318.8/km2 |
| Ryley | Beaver County | April 2, 1910 | 483 | 497 | −2.8% | 2.61 | 185.1/km2 |
| Spring Lake | Parkland County | January 1, 1999 | 699 | 533 | +31.1% | 2.33 | 300.0/km2 |
| Standard | Wheatland County | April 29, 1922 | 353 | 379 | −6.9% | 2.35 | 150.2/km2 |
| Stirling | Warner No. 5, County of | September 3, 1901 | 978 | 1,090 | −10.3% | 2.71 | 360.9/km2 |
| Veteran | Special Area No. 4 | June 30, 1914 | 207 | 249 | −16.9% | 0.84 | 246.4/km2 |
| Vilna | Smoky Lake County | June 23, 1923 | 290 | 249 | +16.5% | 0.96 | 302.1/km2 |
| Warburg | Leduc County | December 31, 1953 | 766 | 789 | −2.9% | 2.68 | 285.8/km2 |
| Warner | Warner No. 5, County of | November 12, 1908 | 373 | 331 | +12.7% | 1.16 | 321.6/km2 |
| Waskatenau | Smoky Lake County | May 19, 1932 | 186 | 255 | −27.1% | 0.6 | 310.0/km2 |
| Youngstown | Special Area No. 3 | December 31, 1936 | 154 | 178 | −13.5% | 1.11 | 138.7/km2 |
| Total villages | — | — | 33,773 | 33,448 | +1.0% | 146.85 | 230.0/km2 |
Summer villages
According to former Section 79 of the Municipal Government Act (MGA), a summer village is an area that:
- has at least 60 parcels of land developed with dwelling buildings; and
- has a population of less than 300 persons where the majority of the persons who would be electors do not permanently reside in that area.
As a result of Section 79 being repealed, summer villages can no longer be formed in Alberta.
Essentially, summer villages were once formed from urban communities with populations of less than 300 people and significant non-permanent populations. When a summer village's population exceeds 300 people, its council may apply to change its status to that of a village, but the change in incorporated status is not mandatory.
Alberta currently has a total of 51 summer villages, with a combined population totalling 5,200 as of 2019.
| Name | Rural municipality | Incorporation date (summer village) |
Population (2016) |
Population (2011) |
Change (%) |
Land area (km²) |
Population density (per km²) |
|---|---|---|---|---|---|---|---|
| Argentia Beach | Wetaskiwin No. 10, County of | January 1, 1967 | 27 | 15 | +80.0% | 0.73 | 37.0/km2 |
| Betula Beach | Parkland County | January 1, 1960 | 16 | 10 | +60.0% | 0.25 | 64.0/km2 |
| Birch Cove | Lac Ste. Anne County | December 31, 1988 | 45 | 45 | 0.0% | 0.3 | 150.0/km2 |
| Birchcliff | Lacombe County | January 1, 1972 | 117 | 112 | +4.5% | 1.03 | 113.6/km2 |
| Bondiss | Athabasca County | January 1, 1983 | 110 | 106 | +3.8% | 1.23 | 89.4/km2 |
| Bonnyville Beach | Bonnyville No. 87, M.D. of | January 1, 1958 | 84 | 95 | −11.6% | 0.17 | 494.1/km2 |
| Burnstick Lake | Clearwater County | December 31, 1991 | 15 | 16 | −6.2% | 0.18 | 83.3/km2 |
| Castle Island | Lac Ste. Anne County | January 1, 1955 | 10 | 19 | −47.4% | 0.05 | 200.0/km2 |
| Crystal Springs | Wetaskiwin No. 10, County of | January 1, 1957 | 51 | 90 | −43.3% | 0.57 | 89.5/km2 |
| Ghost Lake | Bighorn No. 8, M.D. of | December 31, 1953 | 82 | 81 | +1.2% | 0.67 | 122.4/km2 |
| Golden Days | Leduc County | January 1, 1965 | 160 | 141 | +13.5% | 2.28 | 70.2/km2 |
| Grandview | Wetaskiwin No. 10, County of | January 1, 1967 | 114 | 108 | +5.6% | 0.79 | 144.3/km2 |
| Gull Lake | Lacombe County | September 1, 1993 | 176 | 122 | +44.3% | 0.7 | 251.4/km2 |
| Half Moon Bay | Lacombe County | January 1, 1978 | 42 | 38 | +10.5% | 0.11 | 381.8/km2 |
| Horseshoe Bay | St. Paul No. 19, County of | January 1, 1985 | 49 | 37 | +32.4% | 1.14 | 43.0/km2 |
| Island Lake | Athabasca County | January 1, 1958 | 228 | 243 | −6.2% | 1.85 | 123.2/km2 |
| Island Lake South | Athabasca County | January 1, 1983 | 61 | 72 | −15.3% | 0.67 | 91.0/km2 |
| Itaska Beach | Leduc County | June 30, 1953 | 23 | 20 | +15.0% | 0.29 | 79.3/km2 |
| Jarvis Bay | Red Deer County | January 1, 1986 | 213 | 203 | +4.9% | 0.53 | 401.9/km2 |
| Kapasiwin | Parkland County | September 1, 1993 | 10 | 10 | 0.0% | 0.3 | 33.3/km2 |
| Lakeview | Parkland County | October 25, 1913 | 30 | 26 | +15.4% | 0.35 | 85.7/km2 |
| Larkspur | Westlock County | January 1, 1985 | 44 | 38 | +15.8% | 0.26 | 169.2/km2 |
| Ma-Me-O Beach | Wetaskiwin No. 10, County of | December 31, 1948 | 110 | 113 | −2.7% | 0.52 | 211.5/km2 |
| Mewatha Beach | Athabasca County | January 1, 1978 | 90 | 79 | +13.9% | 0.8 | 112.5/km2 |
| Nakamun Park | Lac Ste. Anne County | January 1, 1966 | 96 | 36 | +166.7% | 0.45 | 213.3/km2 |
| Norglenwold | Red Deer County | January 1, 1965 | 273 | 232 | +17.7% | 0.62 | 440.3/km2 |
| Norris Beach | Wetaskiwin No. 10, County of | December 31, 1988 | 38 | 46 | −17.4% | 0.2 | 190.0/km2 |
| Parkland Beach | Ponoka County | January 1, 1984 | 153 | 124 | +23.4% | 0.95 | 161.1/km2 |
| Pelican Narrows | Bonnyville No. 87, M.D. of | July 1, 1979 | 151 | 162 | −6.8% | 0.72 | 209.7/km2 |
| Point Alison | Parkland County | December 31, 1950 | 10 | 15 | −33.3% | 0.16 | 62.5/km2 |
| Poplar Bay | Wetaskiwin No. 10, County of | January 1, 1967 | 103 | 80 | +28.8% | 0.67 | 153.7/km2 |
| Rochon Sands | Stettler No. 6, County of | May 17, 1929 | 86 | 65 | +32.3% | 2.16 | 39.8/km2 |
| Ross Haven | Lac Ste. Anne County | January 1, 1962 | 160 | 137 | +16.8% | 0.71 | 225.4/km2 |
| Sandy Beach | Lac Ste. Anne County | January 1, 1956 | 278 | 223 | +24.7% | 2.4 | 115.8/km2 |
| Seba Beach | Parkland County | August 20, 1920 | 169 | 143 | +18.2% | 0.86 | 196.5/km2 |
| Silver Beach | Wetaskiwin No. 10, County of | December 31, 1953 | 65 | 52 | +25.0% | 0.64 | 101.6/km2 |
| Silver Sands | Lac Ste. Anne County | January 1, 1969 | 160 | 85 | +88.2% | 2.41 | 66.4/km2 |
| South Baptiste | Athabasca County | January 1, 1983 | 66 | 52 | +26.9% | 0.93 | 71.0/km2 |
| South View | Lac Ste. Anne County | January 1, 1970 | 67 | 35 | +91.4% | 0.41 | 163.4/km2 |
| Sunbreaker Cove | Lacombe County | December 31, 1990 | 81 | 69 | +17.4% | 0.5 | 162.0/km2 |
| Sundance Beach | Leduc County | January 1, 1970 | 73 | 82 | −11.0% | 0.44 | 165.9/km2 |
| Sunrise Beach | Lac Ste. Anne County | December 31, 1988 | 135 | 149 | −9.4% | 1.66 | 81.3/km2 |
| Sunset Beach | Athabasca County | May 1, 1977 | 49 | 44 | +11.4% | 0.74 | 66.2/km2 |
| Sunset Point | Lac Ste. Anne County | January 1, 1959 | 169 | 221 | −23.5% | 1.15 | 147.0/km2 |
| Val Quentin | Lac Ste. Anne County | January 1, 1966 | 252 | 157 | +60.5% | 0.31 | 812.9/km2 |
| Waiparous | Bighorn No. 8, M.D. of | January 1, 1986 | 49 | 42 | +16.7% | 0.41 | 119.5/km2 |
| West Baptiste | Athabasca County | January 1, 1983 | 38 | 52 | −26.9% | 0.65 | 58.5/km2 |
| West Cove | Lac Ste. Anne County | January 1, 1963 | 149 | 121 | +23.1% | 1.33 | 112.0/km2 |
| Whispering Hills | Athabasca County | January 1, 1983 | 142 | 108 | +31.5% | 1.68 | 84.5/km2 |
| White Sands | Stettler No. 6, County of | January 1, 1980 | 120 | 91 | +31.9% | 1.58 | 75.9/km2 |
| Yellowstone | Lac Ste. Anne County | January 1, 1965 | 137 | 124 | +10.5% | 0.28 | 489.3/km2 |
| Total summer villages | — | — | 5,176 | 4,586 | +12.9% | 40.79 | 126.9/km2 |
Specialized municipalities
According to Section 83 of the Municipal Government Act (MGA), a municipality may incorporate as a specialized municipality under one of the following three scenarios:
- where the Minister of Alberta Municipal Affairs (AMA) is satisfied that the other incorporated statuses under the MGA do not meet the needs of the municipality's residents;
- to form a local government that, in the opinion of the Minister of AMA, will provide for the orderly development of the municipality in a similar fashion to the other incorporated statuses within the MGA; or
- for any other circumstances that are deemed appropriate by the Minister of AMA.
Essentially, specialized municipalities are municipalities that are unconventional in nature compared to other municipalities in Alberta, and they are incorporated under the authority of the existing MGA instead of relying on the creation of their own separate acts (i.e., the Special Areas Act allowed the incorporation of Alberta's three special areas and the Metis Settlements Act allowed the incorporation of Alberta's eight Métis settlements).
Alberta's six specialized municipalities have a combined population totalling 242,395 as of 2019.
| Name | Region | Incorporation date (specialized municipality) |
Council size |
Municipal census population (year) |
2021 Census of Population | ||||
|---|---|---|---|---|---|---|---|---|---|
| Population (2021) |
Population (2016) |
Change (%) |
Land area (km2) |
Population density (/km2) |
|||||
| Crowsnest Pass, Municipality of | Southern Alberta | January 16, 2008 | 7 | 5,695 | 5,589 | +1.9% | 370.15 | 15.4 | |
| Jasper, Municipality of | Alberta's Rockies | July 20, 2001 | 7 |
4,584 (2011) |
4,738 | 4,590 | +3.2% | 921.90 | 5.1 |
| Lac La Biche County | Northern Alberta | January 1, 2018 | 9 |
8,544 (2016) |
7,673 | 8,330 | −7.9% | 12,527.48 | 0.6 |
| Mackenzie County | Northern Alberta | June 23, 1999 | 10 |
11,750 (2015) |
12,804 | 11,171 | +14.6% | 79,629.26 | 0.2 |
| Strathcona County | Edmonton Metro | January 1, 1996 | 9 |
95,597 (2015) |
99,225 | 98,044 | +1.2% | 1,170.65 | 84.8 |
| Wood Buffalo, Regional Municipality of | Northern Alberta | April 1, 1995 | 11 |
81,948 (2015) |
72,326 | 71,589 | +1.0% | 60,843.88 | 1.2 |
| Total specialized municipalities | — | 53 | — | 202,461 | 199,298 | +1.6% | 155,463.32 | 1.3 | |
| Province of Alberta | — | — | —| | 4,262,635 | 4,067,175 | +4.8% | 634,658.27 | 6.7 | |
Rural municipalities
Municipal districts
According to Section 78 of the Municipal Government Act (MGA), a municipal district is an area in which:
- the majority of the buildings used as dwellings are on parcels of land with an area of at least 1,850 m2 (19,900 sq ft); and
- there is a population of 1,000 or more.
Essentially, municipal districts are large rural areas in which their citizens reside on farms, country residential subdivisions or unincorporated communities (i.e., hamlets, localities and other settlements).
In Alberta, the term county is synonymous with the term municipal district – it is not its own incorporated municipal status that is different from that of a municipal district. As such, Alberta Municipal Affairs provides municipal districts with the opportunity to brand themselves either as municipal districts or counties in their official names.
Of Alberta's 63 municipal districts, 46 of them brand themselves as counties. Over the past 30 years, Alberta has observed a trend of numerous municipal districts rebranding themselves as counties through official name changes. Some of the reasons why a municipal district would rebrand itself as a county include that the term county is: more recognizable by the general public; has a more traditional appeal; and is more marketable from an economic development perspective.
The last municipal district (MD) to rebrand itself as a county was the MD of Foothills No. 31, which was renamed as Foothills County on January 1, 2019.
Alberta's 63 municipal districts have a combined population totalling 471,852 as of 2019.
| Municipal district (MD) | Incorporation date |
Census division |
Council size |
Municipal census population (year) |
Population (2016) |
Population (2011) |
Change (%) |
Land area (km2) |
Population density (per km2) |
|---|---|---|---|---|---|---|---|---|---|
| MD of Acadia No. 34 | December 9, 1913 | 4 | 5 | 493 | 495 | −0.4 | 1,082.60 | 0.5 | |
| Athabasca County | January 1, 1947 | 13 | 9 | 7,869 | 7,662 | 2.7 | 6,124.43 | 1.3 | |
| County of Barrhead No. 11 | January 1, 1955 | 13 | 7 | 6,288 | 6,096 | 3.1 | 2,406.25 | 2.6 | |
| Beaver County | February 1, 1943 | 10 | 5 | 5,905 | 5,689 | 3.8 | 3,317.57 | 1.8 | |
| Big Lakes County | January 1, 1995 | 17 | 9 |
3,861 (2013) |
5,672 | 5,912 | −4.1 | 13,942.43 | 0.4 |
| MD of Bighorn No. 8 | January 1, 1988 | 15 | 5 | 1,334 | 1,341 | −0.5 | 2,761.18 | 0.5 | |
| Birch Hills County | January 1, 1995 | 19 | 7 | 1,553 | 1,582 | −1.8 | 2,859.60 | 0.5 | |
| MD of Bonnyville No. 87 | January 1, 1955 | 12 | 7 |
11,836 (2014) |
13,575 | 11,191 | 21.3 | 6,064.73 | 2.2 |
| Brazeau County | July 1, 1988 | 11 | 7 | 7,771 | 7,132 | 9.0 | 3,005.35 | 2.6 | |
| Camrose County | January 1, 1944 | 10 | 7 | 8,458 | 8,004 | 5.7 | 3,324.21 | 2.5 | |
| Cardston County | January 1, 1954 | 3 | 7 | 4,481 | 4,167 | 7.5 | 3,429.82 | 1.3 | |
| Clear Hills County | January 1, 1995 | 17 | 7 |
2,829 (2012) |
3,023 | 2,801 | 7.9 | 15,125.49 | 0.2 |
| Clearwater County | January 1, 1985 | 9 | 7 | 11,947 | 12,278 | −2.7 | 18,682.45 | 0.6 | |
| Cypress County | January 1, 1985 | 1 | 9 | 7,662 | 7,214 | 6.2 | 13,173.25 | 0.6 | |
| MD of Fairview No. 136 | December 9, 1914 | 19 | 5 | 1,604 | 1,673 | −4.1 | 1,387.58 | 1.2 | |
| Flagstaff County | January 1, 1944 | 7 | 7 | 3,738 | 3,591 | 4.1 | 4,067.58 | 0.9 | |
| Foothills County | January 1, 1954 | 6 | 7 | 22,766 | 21,248 | 7.1 | 3,636.8 | 6.3 | |
| County of Forty Mile No. 8 | January 1, 1954 | 1 | 7 | 3,581 | 3,336 | 7.3 | 7,249.31 | 0.5 | |
| County of Grande Prairie No. 1 | December 21, 1943 | 19 | 9 | 22,303 | 19,724 | 13.1 | 5,802.21 | 3.8 | |
| MD of Greenview No. 16 | January 1, 1994 | 18 | 8 | 5,583 | 5,299 | 5.4 | 32,984.24 | 0.2 | |
| Kneehill County | January 1, 1944 | 5 | 7 | 5,001 | 4,921 | 1.6 | 3,381.02 | 1.5 | |
| Lac Ste. Anne County | January 1, 1944 | 13 | 7 | 10,899 | 10,260 | 6.2 | 2,850.38 | 3.8 | |
| Lacombe County | January 1, 1944 | 8 | 7 | 10,343 | 10,307 | 0.3 | 2,765.16 | 3.7 | |
| Lamont County | January 1, 1944 | 10 | 5 | 3,899 | 3,872 | 0.7 | 2,385.09 | 1.6 | |
| Leduc County | January 1, 1944 | 11 | 7 | 13,780 | 13,494 | 2.1 | 2,601.49 | 5.3 | |
| MD of Lesser Slave River No. 124 | January 1, 1995 | 17 | 7 | 2,803 | 2,929 | −4.3 | 10,074.39 | 0.3 | |
| Lethbridge County | January 1, 1954 | 2 | 7 | 10,353 | 10,046 | 3.1 | 2,836.64 | 3.6 | |
| County of Minburn No. 27 | January 30, 1942 | 10 | 7 | 3,188 | 3,383 | −5.8 | 2,913.02 | 1.1 | |
| Mountain View County | January 1, 1944 | 6 | 7 | 13,074 | 12,359 | 5.8 | 3,782.64 | 3.5 | |
| County of Newell | January 1, 1953 | 2 | 10 | 7,524 | 7,138 | 5.4 | 5,904.67 | 1.3 | |
| County of Northern Lights | January 1, 1995 | 17 | 7 | 4,200 | 4,117 | 2.0 | 20,755.37 | 0.2 | |
| Northern Sunrise County | April 1, 1994 | 17 | 6 |
1,933 (2013) |
1,891 | 1,791 | 5.6 | 21,150.97 | 0.1 |
| MD of Opportunity No. 17 | August 1, 1995 | 17 | 11 |
2,639 (2016) |
3,181 | 3,074 | 3.5 | 29,142.10 | 0.1 |
| County of Paintearth No. 18 | January 1, 1944 | 7 | 7 | 2,102 | 2,029 | 3.6 | 3,283.36 | 0.6 | |
| Parkland County | January 1, 1969 | 11 | 7 | 32,097 | 30,568 | 5.0 | 2,390.23 | 13.4 | |
| MD of Peace No. 135 | December 11, 1916 | 19 | 5 | 1,747 | 1,446 | 20.8 | 847.47 | 2.1 | |
| MD of Pincher Creek No. 9 | January 1, 1944 | 3 | 5 | 2,965 | 3,158 | −6.1 | 3,482.05 | 0.9 | |
| Ponoka County | January 1, 1952 | 8 | 5 | 9,806 | 8,856 | 10.7 | 2,814.26 | 3.5 | |
| MD of Provost No. 52 | March 1, 1943 | 7 | 7 | 2,205 | 2,288 | −3.6 | 3,628.39 | 0.6 | |
| MD of Ranchland No. 66 | January 1, 1995 | 15 | 3 |
104 (2013) |
92 | 79 | 16.5 | 2,638.70 | 0 |
| Red Deer County | January 1, 1944 | 8 | 7 | 19,541 | 18,316 | 6.7 | 3,961.85 | 4.9 | |
| Rocky View County | January 1, 1955 | 6 | 9 |
38,055 (2013) |
39,407 | 35,754 | 10.2 | 3,836.33 | 10.3 |
| Saddle Hills County | January 1, 1995 | 19 | 7 | 2,225 | 2,288 | −2.8 | 5,838.15 | 0.4 | |
| Smoky Lake County | March 1, 1943 | 12 | 5 | 4,107 | 3,910 | 5.0 | 3,412.92 | 1.2 | |
| MD of Smoky River No. 130 | January 1, 1952 | 19 | 6 | 2,023 | 2,126 | −4.8 | 2,840.14 | 0.7 | |
| MD of Spirit River No. 133 | December 11, 1916 | 19 | 4 | 700 | 713 | −1.8 | 683.60 | 1 | |
| County of St. Paul No. 19 | January 30, 1942 | 12 | 7 |
6,168 (2012) |
5,827 | 5,405 | 7.8 | 3,309.44 | 1.8 |
| Starland County | February 1, 1943 | 5 | 5 |
2,071 (2013) |
2,066 | 2,057 | 0.4 | 2,559.95 | 0.8 |
| County of Stettler No. 6 | March 1, 1943 | 7 | 7 | 5,322 | 5,103 | 4.3 | 4,018.84 | 1.3 | |
| Sturgeon County | January 1, 1955 | 11 | 7 | 20,495 | 19,578 | 4.7 | 2,090.13 | 9.8 | |
| MD of Taber | January 1, 1954 | 2 | 7 |
7,173 (2016) |
7,098 | 6,851 | 3.6 | 4,201.65 | 1.7 |
| Thorhild County | January 1, 1955 | 13 | 5 | 3,254 | 3,417 | −4.8 | 2,001.74 | 1.6 | |
| County of Two Hills No. 21 | January 1, 1944 | 10 | 5 | 3,322 | 3,160 | 5.1 | 2,637.18 | 1.3 | |
| County of Vermilion River | January 1, 1944 | 10 | 7 |
8,116 (2015) |
8,267 | 7,905 | 4.6 | 5,519.75 | 1.5 |
| Vulcan County | January 1, 1951 | 5 | 7 |
3,839 (2012) |
3,984 | 3,875 | 2.8 | 5,433.43 | 0.7 |
| MD of Wainwright No. 61 | January 30, 1942 | 7 | 7 | 4,479 | 4,138 | 8.2 | 4,156.56 | 1.1 | |
| County of Warner No. 5 | January 1, 1954 | 2 | 7 | 3,847 | 3,841 | 0.2 | 4,531.55 | 0.8 | |
| Westlock County | February 1, 1943 | 13 | 7 | 7,220 | 7,644 | −5.5 | 3,171.83 | 2.3 | |
| County of Wetaskiwin No. 10 | February 1, 1943 | 11 | 7 | 11,181 | 10,866 | 2.9 | 3,132.06 | 3.6 | |
| Wheatland County | January 1, 1955 | 5 | 7 | 8,788 | 8,285 | 6.1 | 4,545.92 | 1.9 | |
| MD of Willow Creek No. 26 | January 1, 1954 | 3 | 7 | 5,179 | 5,107 | 1.4 | 4,558.14 | 1.1 | |
| Woodlands County | January 1, 1994 | 13 | 7 |
4,612 (2014) |
4,754 | 4,306 | 10.4 | 7,669.13 | 0.6 |
| Yellowhead County | January 1, 1994 | 14 | 9 | 10,995 | 10,469 | 5.0 | 22,293.16 | 0.5 | |
| Total municipal districts | — | — | 437 | — | 479,167 | 4,560,664 | 5.1 | 399,087.25 | 1.2 |
Improvement districts
According to Section 581 of the Municipal Government Act (MGA), Alberta's Lieutenant Governor in Council, on the recommendation of the Minister of Municipal Affairs, may form an improvement district. Section 582 of the MGA requires that the order to form an improvement district must describe its boundaries and give it an official name.
Alberta currently has seven improvement districts, which have a combined population totaling 2,146. With some exceptions, their boundaries are coterminous with that of a national or provincial park. Five of them are located within national parks, and two are within provincial parks.
| Name | Incorporation date (improvement district) |
Population (2011) |
Population (2006) |
Change (%) | Land area (km2) |
Population density (per km2) |
Remarks |
|---|---|---|---|---|---|---|---|
| Improvement District No. 4 (Waterton) | January 1, 1944 | 88 | 160 | −45.0 | 480.58 | 0.18 | Coincident with Waterton Lakes National Park |
| Improvement District No. 9 (Banff) | April 1, 1945 | 1,175 | 938 | 25.3 | 6,782.23 | 0.17 | Coincident with Banff National Park excluding the Town of Banff |
| Improvement District No. 12 (Jasper National Park) | April 1, 1945 | 34 | 24 | 41.7 | 10,181.58 | 0.003 | Coincident with Jasper National Park excluding the Municipality of Jasper |
| Improvement District No. 13 (Elk Island) | April 1, 1958 | 10 | 21 | −52.4 | 165.28 | 0.06 | Coincident with Elk Island National Park |
| Improvement District No. 24 (Wood Buffalo) | January 1, 1967 | 590 | 422 | 39.8 | 33,412.25 | 0.02 | Coincident with the Alberta portion of Wood Buffalo National Park excluding Peace Point 222 |
| Improvement District No. 25 (Willmore Wilderness) | January 2, 1994 | 0 | 0 | — | 4,604.97 | 0.0 | Coincident with Willmore Wilderness Park |
| Kananaskis Improvement District | January 1, 1983 | 249 | 429 | −42.0 | 4,210.72 | 0.06 | Consists mostly of Kananaskis Country |
| Total improvement districts | — | 2,463 | 1,994 | 7.6 | 65,642.17 | 0.03 | — |
Special areas
Special areas are rural municipalities created in 1938 under the authority of the Special Areas Act. A special area is not to be confused with a specialized municipality, which is a completely different municipal status.
Alberta's three special areas had a combined population totalling 4,184 in 2016.
| Special area | Incorporation date (special area) |
Population (2016) |
Population (2011) |
Change (%) | Area (km²) | Population density (/km²) |
|---|---|---|---|---|---|---|
| Special Area No. 2 | April 7, 1959 | 1,905 | 2,025 | −5.9 | 9,347.57 | 0.20 |
| Special Area No. 3 | April 7, 1959 | 1,042 | 1,122 | −7.1 | 6,625.58 | 0.16 |
| Special Area No. 4 | January 1, 1969 | 1,237 | 1,352 | −8.5 | 4,402.64 | 0.28 |
| Total special areas | — | 4,184 | 4,499 | −7.0 | 20,375.79 | 0.21 |
Unincorporated communities
Urban service areas
An urban service area is a type of hamlet that is not officially defined under the Municipal Government Act (MGA). However, the Province of Alberta recognizes it as equivalent to a city for the purposes of program delivery and grant eligibility according to the Orders in Council that established the Regional Municipality (RM) of Wood Buffalo and Strathcona County as specialized municipalities.
These Orders in Council (see Schedule 1, Section 7 and Schedule 1, Section 3 respectively) also state that:
- the specialized municipalities shall provide to the Province of Alberta any information required to administer programs or to determine the amount of grants which would have been paid if the urban service areas were incorporated cities; and
- for the purposes of enactments affecting roads, culverts, ditches, drains, and highways, the urban service areas are deemed to be cities.
Essentially, urban services areas meet the eligibility requirements of the MGA to incorporate as a city. As such, they are Alberta's largest hamlets.
There are currently two urban services areas in Alberta:
- Fort McMurray; and
- Sherwood Park.
Fort McMurray, within the jurisdiction of the RM of Wood Buffalo, was formerly a city prior its amalgamation with Improvement District No. 143 on April 1, 1995. It was designated an urban service area at the time of the amalgamation.
Sherwood Park has always been an unincorporated community under the jurisdiction of Strathcona County. It became an urban service area when Strathcona County changed its status from a municipal district to a specialized municipality on January 1, 1996.
Hamlets
According to Section 59 of the Municipal Government Act (MGA), hamlets are unincorporated communities that:
- consist of five or more buildings used as dwellings, a majority of which are on parcels of land smaller than 1,850 m2 (19,900 sq ft);
- have a generally accepted boundary and name; and
- contain parcels of land that are used for non‑residential purposes.
Further, Section 59 of the MGA provides the councils of municipal districts (or counties) and specialized municipalities the authority to designate unincorporated communities within its boundaries as hamlets. Hamlets may also be designated within improvement districts and special areas by the Minister of Municipal Affairs pursuant to Section 590 of the MGA and Section 10 of the Special Areas Act respectively.
When a hamlet's population reaches 300, it becomes eligible to incorporated as a village under Section 80 of the MGA, so long as the majority of the buildings are still on parcels of land smaller than 1,850 m2 (19,900 sq ft). However, it is a modern-day rarity for a hamlet to incorporate as a village – Barnwell and Wabamun were the last two to do so both on January 1, 1980. It is much more common these days for villages to revert to hamlet status through the dissolution process instead.
There are currently 403 hamlets in Alberta, two of which are the urban services areas presented above.
Townsites
A townsite is a type of unincorporated community that is not officially defined under the Municipal Government Act (MGA), but it is generally regarded as an independent urban area within an Indian reserve that is comparable in population, land area, services, and built form, to that of Alberta's incorporated towns. Essentially, townsites would meet the eligibility requirements of the MGA to incorporate as a town if they were not on Indian reserve lands under federal jurisdiction.
Redwood Meadows is Alberta's only townsite at this time and is located within the Tsuutʼina Nation.
Other unincorporated communities
Métis settlements
Métis settlements are rural areas inhabited by the indigenous Métis in Alberta and were established and recognized in 1936 under the Métis Population Betterment Act. The settlements provide an autonomous land base, allow better access to education, health and other social services, and provide economic development opportunities for the only recognized Métis land-base in Canada. Métis settlements now operate under the authority of the Métis Settlements Act. These eight Métis settlements are governed by a unique Métis government known as the Métis Settlements General Council (MSGC).
Alberta currently has eight Métis settlements, all of which are in the northern half of the province. The official names of the eight settlements, and the municipal districts they are within, are as follows:
| Name |
Municipal district or specialized municipality |
2021 Census of Population | ||||
|---|---|---|---|---|---|---|
| Population (2021) |
Population (2016) |
Change (%) |
Land area (km2) |
Population density (/km2) |
||
| Buffalo Lake | Smoky Lake County | 379 | 712 | −46.8% | 335.68 | 1.1 |
| East Prairie | Big Lakes County | 310 | 304 | +2.0% | 328.42 | 0.9 |
| Elizabeth | MD of Bonnyville No. 87 | 594 | 653 | −9.0% | 246.45 | 2.4 |
| Fishing Lake | MD of Bonnyville No. 87 | 414 | 446 | −7.2% | 348.64 | 1.2 |
| Gift Lake |
Big Lakes County Northern Sunrise County |
625 | 658 | −5.0% | 803.29 | 0.8 |
| Kikino |
Smoky Lake County Lac La Biche County |
978 | 934 | +4.7% | 441.69 | 2.2 |
| Paddle Prairie | County of Northern Lights | 551 | 544 | +1.3% | 1,726.45 | 0.3 |
| Peavine | Big Lakes County | 387 | 607 | −36.2% | 798.95 | 0.5 |
| Total Metis settlements | 4,238 | 4,858 | −12.8% | 5,029.57 | 0.8 | |
| Province of Alberta | 4,262,635 | 4,067,175 | +4.8% | 634,658.27 | 6.7 | |
- *Areas generated from provincial Métis settlement boundary data.
Very small portions of the Gift Lake Métis Settlement and the Kikino Métis Settlement are also located within Northern Sunrise County and Lac La Biche County respectively.
Alberta's eight Métis settlements have a combined population totalling 5,632 as of 2018.
Indian reserves
Indian reserves in Alberta cover a total area of 656,660 ha (1,622,630 acres) and range in size from 441 ha (1,089 acres) to 143,529 ha (354,667 acres). Under the Constitution Act, 1982, legislative authority over Indian reserves is allocated to the Parliament of Canada. The Government of Canada exercises executive authority over Indian reserves through Indigenous and Northern Affairs Canada. Local administration is exercised by Band councils whose members are elected by members of the reserve.
