List of U.S. states and territories by religiosity
The degree of religiosity in the population of the United States can be compared to that in other countries and compared state-by-state, based on individual self-assessment and polling data.
Methodologies
The Gallup Poll assesses religiosity around the world, asking "Is religion important in your daily life?" and in the United States by state, asking the degree to which respondents consider themselves to be religious. The Pew Research Center and Public Religion Research Institute have conducted studies of reported frequency of attendance to religious service. The Harris Poll has conducted surveys of the percentage of people who believe in God.
Results
Religious Denominations (Pew Research 2014)
| Region | Protestant (%) | Catholic (%) | The Church of Jesus Christ of Latter-day Saints (%) | Other Christian (%) | Other (%) | Irreligion (%) | Don't know (%) | References |
|---|---|---|---|---|---|---|---|---|
| Alabama | 80.0 | 7.0 | 1.0 | <1.0 | 1.0 | 12.0 | 1.0 | |
| Mississippi | 79.0 | 4.0 | 1.0 | <1.0 | 2.0 | 14.0 | 1.0 | |
| Tennessee | 77.0 | 6.0 | 1.0 | 1.0 | 3.0 | 14.0 | 1.0 | |
| Arkansas | 75.0 | 8.0 | 1.0 | <1.0 | 3.0 | 18.0 | 1.0 | |
| West Virginia | 73.0 | 6.0 | 2.0 | <1.0 | 3.0 | 18.0 | 1.0 | |
| Oklahoma | 70.0 | 8.0 | 1.0 | <1.0 | 2.0 | 18.0 | 1.0 | |
| Georgia | 70.0 | 9.0 | 1.0 | 2.0 | 3.0 | 18.0 | 1.0 | |
| North Carolina | 69.0 | 9.0 | 1.0 | 2.0 | 3.0 | 20.0 | 1.0 | |
| South Carolina | 68.0 | 10.0 | 1.0 | 2.0 | 3.0 | 19.0 | 1.0 | |
| Kentucky | 67.0 | 10.0 | <1.0 | <1.0 | 2.0 | 22.0 | 1.0 | |
| Iowa | 65.0 | 18.0 | <1.0 | <1.0 | 1.0 | 21.0 | 1.0 | |
| Missouri | 60.0 | 16.0 | 1.0 | <1.0 | 3.0 | 20.0 | 1.0 | |
| Virginia | 59.0 | 12.0 | 2.0 | 1.0 | 6.0 | 20.0 | <1.0 | |
| Kansas | 58.0 | 18.0 | 1.0 | 1.0 | 4.0 | 20.0 | <1,0 | |
| Louisiana | 58.0 | 26.0 | <1.0 | 2.0 | 2.0 | 13.0 | 1.0 | |
| South Dakota | 58.0 | 22.0 | <1.0 | <1.0 | 3.0 | 18.0 | <1.0 | |
| Ohio | 55.0 | 18.0 | 1.0 | 1.0 | 4.0 | 22.0 | <1.0 | |
| Indiana | 55.0 | 18.0 | 1.0 | <1.0 | 2.0 | 26.0 | <1.0 | |
| Maryland | 54.0 | 15.0 | 1.0 | 2.0 | 8.0 | 23.0 | <1.0 | |
| Michigan | 54.0 | 18.0 | <1.0 | 2.0 | 5.0 | 24.0 | 1.0 | |
| Nebraska | 53.0 | 23.0 | 1.0 | <1.0 | 4.0 | 20.0 | <1,0 | |
| North Dakota | 52.0 | 26.0 | <1.0 | <1.0 | 3.0 | 20.0 | <1.0 | |
| Minnesota | 50.0 | 22.0 | 1.0 | <1.0 | 5.0 | 20.0 | 2.0 | |
| Texas | 50.0 | 23.0 | 1.0 | 2.0 | 4.0 | 18.0 | <1.0 | |
| Pennsylvania | 47.0 | 24.0 | <1.0 | 1.0 | 6.0 | 21.0 | 1.0 | |
| United States | 46.5 | 20.8 | 1.6 | 1.7 | 5.9 | 22.8 | 0.6 | |
| Delaware | 46.0 | 22.0 | <1.0 | 1.0 | 6.0 | 23.0 | 1.0 | |
| Florida | 46.0 | 21.0 | 1.0 | 2.0 | 6.0 | 24.0 | <1.0 | |
| Wisconsin | 44.0 | 25.0 | <1.0 | 2.0 | 4.0 | 25.0 | <1.0 | |
| Colorado | 43.0 | 16.0 | 2.0 | 2.0 | 5.0 | 29.0 | 2.0 | |
| Illinois | 43.0 | 28.0 | <1.0 | 2.0 | 6.0 | 22.0 | 1.0 | |
| Oregon | 43.0 | 12.0 | 4.0 | 2.0 | 7.0 | 31.0 | 1.0 | |
| Wyoming | 43.0 | 14.0 | 9.0 | 4.0 | 3.0 | 26.0 | <1.0 | |
| Montana | 42.0 | 17.0 | 4.0 | 2.0 | 5.0 | 30.0 | <1.0 | |
| District of Columbia | 41.0 | 20.0 | 2.0 | 1.0 | 9.0 | 25.0 | 1.0 | |
| Washington | 40.0 | 17.0 | 3.0 | 3.0 | 6.0 | 32.0 | 1.0 | |
| Arizona | 39.0 | 21.0 | 5.0 | 1.0 | 6.0 | 27.0 | <1.0 | |
| Hawaii | 38.0 | 20.0 | 3.0 | 2.0 | 10.0 | 26.0 | 1.0 | |
| New Mexico | 38.0 | 34.0 | 2.0 | 1.0 | 4.0 | 21.0 | <1.0 | |
| Alaska | 37.0 | 16.0 | 5.0 | 5.0 | 6.0 | 31.0 | 1.0 | |
| Idaho | 37.0 | 10.0 | 19.0 | 1.0 | 4.0 | 27.0 | <1.0 | |
| Maine | 37.0 | 21.0 | 2.0 | 1.0 | 7.0 | 31.0 | 2.0 | |
| Connecticut | 35.0 | 33.0 | 1.0 | 2.0 | 7.0 | 23.0 | 1.0 | |
| Nevada | 35.0 | 25.0 | 4.0 | 2.0 | 5.0 | 28.0 | 1.0 | |
| California | 32.0 | 28.0 | 1.0 | 3.0 | 9.0 | 27.0 | 1.0 | |
| New Jersey | 31.0 | 34.0 | 1.0 | 2.0 | 14.0 | 18.0 | 1.0 | |
| New Hampshire | 30.0 | 26.0 | 1.0 | 2.0 | 5.0 | 36.0 | <1.0 | |
| Rhode Island | 30.0 | 42.0 | 1.0 | 2.0 | 5.0 | 20.0 | 1.0 | |
| Vermont | 30.0 | 22.0 | <1.0 | 1.0 | 8.0 | 37.0 | 2.0 | |
| New York | 26.0 | 31.0 | <1.0 | 2.0 | 12.0 | 27.0 | 1.0 | |
| Massachusetts | 21.0 | 34.0 | 1.0 | 1.0 | 9.0 | 32.0 | 1.0 | |
| Utah | 13.0 | 5.0 | 55.0 | <1.0 | 4.0 | 22.0 | 1.0 |
Religions by metropolitan areas
| Metro area | Christian (%) | Evangelical (%) | Mainline (%) | Historically black (%) |
Catholic (%) | The Church of Jesus Christ of Latter-day Saints (%) | Non- Christian faiths (%) |
None (%) |
|---|---|---|---|---|---|---|---|---|
| Dallas | 78.0 | 38.0 | 14.0 | 7.0 | 15.0 | 1.0 | 4.0 | 18.0 |
| Atlanta | 76.0 | 33.0 | 12.0 | 18.0 | 11.0 | 1.0 | 3.0 | 20.0 |
| Houston | 73.0 | 30.0 | 11.0 | 9.0 | 19.0 | 1.0 | 4.0 | 20.0 |
| Chicago | 71.0 | 16.0 | 11.0 | 8.0 | 34.0 | <1.0 | 7.0 | 22.0 |
| Riverside, Calif. | 71.0 | 30.0 | 10.0 | 3.0 | 22.0 | 3.0 | 4.0 | 25.0 |
| Minneapolis | 70.0 | 15.0 | 27.0 | 4.0 | 21.0 | 1.0 | 5.0 | 23.0 |
| San Diego | 68.0 | 14.0 | 16.0 | 2.0 | 32.0 | 2.0 | 5.0 | 27.0 |
| Miami | 68.0 | 20.0 | 11.0 | 8.0 | 27.0 | <1.0 | 10.0 | 21.0 |
| Philadelphia | 68.0 | 13.0 | 17.0 | 11.0 | 26.0 | <1.0 | 8.0 | 24.0 |
| Detroit | 67.0 | 20.0 | 14.0 | 15.0 | 16.0 | <1.0 | 8.0 | 24.0 |
| Phoenix | 66.0 | 25.0 | 11.0 | 1.0 | 21.0 | 6.0 | 7.0 | 26.0 |
| Los Angeles | 65.0 | 18.0 | 9.0 | 3.0 | 32.0 | <1.0 | 9.0 | 25.0 |
| Washington, D.C. | 65.0 | 14.0 | 15.0 | 12.0 | 19.0 | 1.0 | 10.0 | 24.0 |
| New York City | 59.0 | 9.0 | 8.0 | 6.0 | 33.0 | <1.0 | 16.0 | 24.0 |
| Boston | 57.0 | 9.0 | 13.0 | 3.0 | 29.0 | <1.0 | 10.0 | 33.0 |
| Seattle | 52.0 | 23.0 | 10.0 | 1.0 | 15.0 | 1.0 | 10.0 | 37.0 |
| San Francisco | 48.0 | 10.0 | 6.0 | 4.0 | 25.0 | 1.0 | 15.0 | 35.0 |
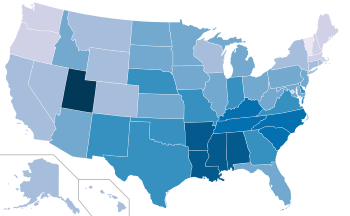
Attendance
|
≥50% attending weekly
45-49% attending weekly
40-44% attending weekly
35-39% attending weekly |
30-34% attending weekly
25-29% attending weekly
20-24% attending weekly
15-19% attending weekly |
A 2013 survey by the Public Religion Research Institute reported that 31% of Americans attend religious services at least weekly. In 2006, a world-wide online Harris Poll surveyed 2,010 U.S. adults and found that 26% of those surveyed attended religious services "every week or more often", 9% went "once or twice a month", 21% went "a few times a year", 3% went "once a year", 22% went "less than once a year", and 18% never attend religious services. A 2013 Harris Poll reported an 8% decline in a belief in God, since a prior 2009 poll.
According to a 2011 Gallup poll, the state with the greatest percentage of respondents identifying as "very religious" was Mississippi (59%), and the state with the smallest percentage were Vermont and New Hampshire (23%), while Florida (39%) and Minnesota (40%) were near the median. A 2014 Pew Research poll found that the states with the greatest percentage of respondents who stated that religion was "very important" or "somewhat important" to their lives were Alabama (90%) and Louisiana (90%), while the state with the smallest percentage was Vermont (57%).
U.S. states and Washington, D.C.

| Rank | State | Percent |
|---|---|---|
| 1 | Utah | 53% |
| 2 | Alabama | 51% |
| 2 | Tennessee | 51% |
| 4 | Mississippi | 49% |
| 5 | South Carolina | 47% |
| 6 | Louisiana | 46% |
| 6 | West Virginia | 46% |
| 8 | Virginia | 44% |
| 9 | Oklahoma | 43% |
| 10 | Georgia | 42% |
| 10 | Texas | 42% |
| 12 | Arkansas | 41% |
| 13 | North Carolina | 39% |
| 13 | Kentucky | 39% |
| 13 | Nebraska | 39% |
| 16 | Ohio | 38% |
| 16 | Wyoming | 38% |
| 18 | Missouri | 37% |
| 18 | Kansas | 37% |
| 18 | Indiana | 37% |
| 21 | South Dakota | 36% |
| 21 | New Mexico | 36% |
| 21 | Iowa | 36% |
| 21 | Rhode Island | 36% |
| 25 | New Jersey | 35% |
| 25 | Florida | 35% |
| 25 | Idaho | 35% |
| 28 | Arizona | 34% |
| 28 | Pennsylvania | 34% |
| 28 | Delaware | 34% |
| 28 | Illinois | 34% |
| 28 | Minnesota | 34% |
| 33 | Michigan | 33% |
| 33 | North Dakota | 33% |
| 35 | Maryland | 31% |
| 35 | California | 31% |
| 35 | Nevada | 31% |
| 35 | Montana | 31% |
| 39 | Colorado | 30% |
| 39 | Alaska | 30% |
| 39 | Washington | 30% |
| 42 | Oregon | 29% |
| 42 | New York | 29% |
| 44 | District of Columbia | 28% |
| 44 | Hawaii | 28% |
| 44 | Connecticut | 28% |
| 47 | Wisconsin | 27% |
| 48 | Massachusetts | 23% |
| 49 | Maine | 22% |
| 49 | New Hampshire | 22% |
| 51 | Vermont | 21% |
| Rank | State | Percent |
|---|---|---|
| 1 | Utah | 51% |
| 2 | Mississippi | 47% |
| 3 | Alabama | 46% |
| 4 | Louisiana | 46% |
| 5 | Arkansas | 45% |
| 6 | South Carolina | 42% |
| 7 | Tennessee | 42% |
| 8 | Kentucky | 41% |
| 9 | North Carolina | 40% |
| 10 | Georgia | 39% |
| 11 | Texas | 39% |
| 12 | Oklahoma | 39% |
| 13 | New Mexico | 36% |
| 14 | Nebraska | 35% |
| 15 | Indiana | 35% |
| 16 | Virginia | 35% |
| 17 | Delaware | 35% |
| 18 | Missouri | 35% |
| 19 | Idaho | 34% |
| 20 | West Virginia | 34% |
| 21 | Arizona | 33% |
| 22 | Kansas | 33% |
| 23 | Michigan | 32% |
| 24 | Ohio | 32% |
| 25 | Illinois | 32% |
| 26 | North Dakota | 32% |
| 27 | Pennsylvania | 32% |
| 28 | Iowa | 32% |
| 29 | Florida | 32% |
| 30 | Maryland | 31% |
| 31 | South Dakota | 31% |
| 32 | Minnesota | 31% |
| 33 | New Jersey | 30% |
| 34 | Wisconsin | 29% |
| 35 | Rhode Island | 28% |
| 36 | Wyoming | 28% |
| 37 | California | 28% |
| 38 | New York | 27% |
| 39 | Nevada | 27% |
| 40 | Montana | 27% |
| 41 | Alaska | 26% |
| 42 | Connecticut | 25% |
| 43 | Colorado | 25% |
| 44 | Hawaii | 25% |
| 45 | Oregon | 24% |
| 46 | Washington | 24% |
| 47 | District of Columbia | 23% |
| 48 | Massachusetts | 22% |
| 49 | Maine | 20% |
| 50 | New Hampshire | 20% |
| 51 | Vermont | 17% |
The table below displays the results of a 2014 survey by Pew Research:
|
State or District |
Overall Religiosity Rank | Believe in God with Certainty | Consider Religion Important | Pray Daily | Attend Weekly Worship Services |
|---|---|---|---|---|---|
| California | 35 | 54% | 47% | 51% | 31% |
| Texas | 11 | 69% | 63% | 63% | 42% |
| Florida | 22 | 64% | 53% | 56% | 35% |
| New York | 43 | 56% | 45% | 48% | 29% |
| Illinois | 33 | 61% | 50% | 51% | 34% |
| Pennsylvania | 27 | 61% | 51% | 54% | 34% |
| Ohio | 17 | 67% | 56% | 57% | 38% |
| Georgia | 8 | 74% | 64% | 64% | 42% |
| Michigan | 27 | 63% | 50% | 53% | 33% |
| North Carolina | 10 | 73% | 62% | 66% | 39% |
| New Jersey | 19 | 60% | 50% | 53% | 35% |
| Virginia | 14 | 67% | 60% | 60% | 44% |
| Washington | 44 | 55% | 44% | 46% | 30% |
| Massachusetts | 50 | 40% | 33% | 37% | 23% |
| Arizona | 27 | 62% | 51% | 55% | 34% |
| Indiana | 22 | 63% | 53% | 52% | 37% |
| Tennessee | 3 | 78% | 71% | 70% | 51% |
| Missouri | 15 | 70% | 56% | 59% | 37% |
| Maryland | 22 | 64% | 50% | 51% | 31% |
| Wisconsin | 44 | 56% | 44% | 46% | 27% |
| Minnesota | 35 | 56% | 46% | 47% | 34% |
| Colorado | 41 | 55% | 47% | 50% | 30% |
| South Carolina | 5 | 74% | 69% | 66% | 47% |
| Alabama | 1 | 82% | 77% | 73% | 51% |
| Louisiana | 4 | 75% | 71% | 68% | 46% |
| Kentucky | 13 | 75% | 63% | 63% | 39% |
| Oregon | 39 | 57% | 45% | 45% | 29% |
| Oklahoma | 8 | 71% | 64% | 65% | 43% |
| Connecticut | 47 | 54% | 42% | 47% | 28% |
| Iowa | 19 | 66% | 53% | 50% | 36% |
| Mississippi | 1 | 82% | 74% | 75% | 49% |
| Arkansas | 5 | 77% | 70% | 65% | 41% |
| Utah | 11 | 61% | 58% | 61% | 53% |
| Kansas | 19 | 66% | 50% | 53% | 37% |
| Nevada | 35 | 59% | 44% | 48% | 31% |
| New Mexico | 18 | 63% | 59% | 55% | 36% |
| Nebraska | 22 | 66% | 54% | 52% | 39% |
| West Virginia | 7 | 77% | 64% | 68% | 46% |
| Idaho | 33 | 62% | 51% | 50% | 35% |
| Hawaii | 41 | 62% | 44% | 52% | 28% |
| Maine | 48 | 48% | 34% | 35% | 22% |
| New Hampshire | 50 | 43% | 33% | 36% | 22% |
| Rhode Island | 35 | 60% | 48% | 48% | 36% |
| Montana | 39 | 64% | 44% | 51% | 31% |
| Delaware | 32 | 61% | 46% | 49% | 34% |
| South Dakota | 16 | 69% | 57% | 56% | 36% |
| Alaska | 44 | 55% | 41% | 49% | 30% |
| North Dakota | 27 | 64% | 53% | 51% | 33% |
| District of Columbia | 27 | 55% | 50% | 51% | 28% |
| Vermont | 48 | 41% | 32% | 33% | 21% |
| Wyoming | 22 | 66% | 49% | 53% | 38% |
U.S. territories
The following is the percentage of Christians and all religions in the U.S. territories as of 2015 (according to the ARDA):
Note that CIA World Factbook data differs from the data below. For example, the CIA World Factbook says that 99.3% of the population in American Samoa is religious.
| Territory | Percent religious (all religions) |
Percent Christian |
Percent religious (non-Christian) |
Percent non-religious |
Unknown / Unspecified |
|---|---|---|---|---|---|
| American Samoa | 98.5% | 97.37% | 1.13% | 0.88% | 0.62% |
| Guam | 95.4% | 91.1% | 4.3% | 1.8% | 2.8% |
| Northern Mariana Islands | 98.85% | 81.13% | 17.72% | 1.11% | 0.04% |
| Puerto Rico | 91.53% | 91.2% | 0.33% | 3.16% | 5.31% |
| US Virgin Islands | 83.3% | 81.83% | 1.47% | 4.04% | 12.66% |