Hornsey (UK Parliament constituency)
| Hornsey | |
|---|---|
| Former Borough constituency for the House of Commons | |
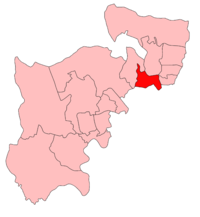
 Hornsey 1885-1918
| |
 Hornsey 1918-1950
| |
| County | 1885–1965: Middlesex 1965–1983: Greater London |
| 1918–1983 | |
| Seats | One |
| Replaced by |
Hornsey & Wood Green (newly created seat) Tottenham (minor additions to) |
| 1885–1918 | |
| Seats | One |
| Type of constituency | County constituency |
| Created from | Middlesex |
| Replaced by | Borough version above and Finchley (newly created seat in 1918 using mainly western part of) |

Hornsey was a constituency that returned one Member of Parliament (MP) to the House of Commons of the UK Parliament, 1885 — 1983. It was then largely replaced by Hornsey & Wood Green. Its voters using the first-past-the-post system elected the Conservative Party candidate at each election. Its closest result was a 1.29% majority at the 1966 election which saw the start of the Second Wilson Ministry. From 1945 onwards the runners-up in the seat were the Labour Party candidates.
History
From 1885 to 1918, the constituency was a county division of Middlesex, and in 1918 it became a parliamentary borough. From 1950 it was a borough constituency.
Boundaries
1885–1918: The Parishes of Hornsey (including South Hornsey) and Finchley (and the area included in the Parliamentary Boroughs of the City of London, Finsbury, and Islington for many wealthy voters this sub-provision gave a choice of which seat to vote for).
1918–1974: The Municipal Borough of Hornsey.
1974–1983: The London Borough of Haringey wards of Central Hornsey, Crouch End, Fortis Green, Highgate, Muswell Hill, South Hornsey, Stroud Green, and Turnpike.
Members of Parliament
| Year | Member | Party | |
|---|---|---|---|
| 1885 | Sir James McGarel-Hogg | Conservative | |
| 1887 | Henry 'Inky' Stephens | Conservative | |
| 1900 | Charles Balfour | Conservative | |
| 1907 | Lawrence Dundas | Conservative | |
| 1916 | Kennedy Jones | Unionist | |
| 1921 | William Ward | Unionist | |
| 1924 | Euan Wallace | Unionist | |
| 1941 | Sir David Gammans | Conservative | |
| 1957 | Muriel Gammans | Conservative | |
| 1966 | Sir Hugh Rossi | Conservative | |
| 1983 | constituency abolished | ||
Election results
Elections in the 1880s

| Party | Candidate | Votes | % | ±% | |
|---|---|---|---|---|---|
| Conservative | James McGarel-Hogg | 4,619 | 58.3 | ||
| Liberal | William Edwardes | 3,299 | 41.7 | ||
| Majority | 1,320 | 16.6 | |||
| Turnout | 7,918 | 74.4 | |||
| Registered electors | 10,648 | ||||
| Conservative win (new seat) | |||||
| Party | Candidate | Votes | % | ±% | |
|---|---|---|---|---|---|
| Conservative | James McGarel-Hogg | Unopposed | |||
| Conservative hold | |||||
McGarel-Hogg was elevated to the peerage, becoming Lord Magheramorne, causing a by-election.

| Party | Candidate | Votes | % | ±% | |
|---|---|---|---|---|---|
| Conservative | Henry Stephens | 4,476 | 64.3 | N/A | |
| Liberal | Horatio Bottomley | 2,488 | 35.7 | New | |
| Majority | 1,988 | 28.6 | N/A | ||
| Turnout | 6,964 | 64.4 | N/A | ||
| Registered electors | 10,814 | ||||
| Conservative hold | Swing | N/A | |||
Elections in the 1890s
| Party | Candidate | Votes | % | ±% | |
|---|---|---|---|---|---|
| Conservative | Henry Stephens | 6,192 | 68.0 | N/A | |
| Liberal | Thomas Rees Sydenham-Jones | 2,913 | 32.0 | N/A | |
| Majority | 3,279 | 36.0 | N/A | ||
| Turnout | 9,105 | 67.7 | N/A | ||
| Registered electors | 13,451 | ||||
| Conservative hold | Swing | N/A | |||
| Party | Candidate | Votes | % | ±% | |
|---|---|---|---|---|---|
| Conservative | Henry Stephens | Unopposed | |||
| Conservative hold | |||||
Elections in the 1900s
| Party | Candidate | Votes | % | ±% | |
|---|---|---|---|---|---|
| Conservative | Charles Balfour | Unopposed | |||
| Conservative hold | |||||
| Party | Candidate | Votes | % | ±% | |
|---|---|---|---|---|---|
| Conservative | Charles Balfour | 8,859 | 54.9 | N/A | |
| Liberal | C W Tomkinson | 7,289 | 45.1 | New | |
| Majority | 1,570 | 9.8 | N/A | ||
| Turnout | 16,148 | 82.2 | N/A | ||
| Registered electors | 19,651 | ||||
| Conservative hold | Swing | N/A | |||
| Party | Candidate | Votes | % | ±% | |
|---|---|---|---|---|---|
| Conservative | Lawrence Dundas | Unopposed | |||
| Conservative hold | |||||
Elections in the 1910s
| Party | Candidate | Votes | % | ±% | |
|---|---|---|---|---|---|
| Conservative | Lawrence Dundas | 12,014 | 58.2 | +3.3 | |
| Liberal | Robert Dummett | 8,633 | 41.8 | -3.3 | |
| Majority | 3,381 | 16.4 | N/A | ||
| Turnout | 20,647 | 87.7 | N/A | ||
| Conservative hold | Swing | N/A | |||
| Party | Candidate | Votes | % | ±% | |
|---|---|---|---|---|---|
| Conservative | Lawrence Dundas | 11,066 | 59.2 | +1.0 | |
| Liberal | Robert Dummett | 7,613 | 40.8 | -1.0 | |
| Majority | 3,453 | 18.4 | +2.0 | ||
| Turnout | 18,679 | 79.4 | -8.3 | ||
| Conservative hold | Swing | +1.0 | |||
General Election 1914–15:
Another General Election was required to take place before the end of 1915. The political parties had been making preparations for an election to take place and by July 1914, the following candidates had been selected;
- Unionist: Lawrence Dundas
- Liberal:
| Party | Candidate | Votes | % | ±% | |
|---|---|---|---|---|---|
| Unionist | Kennedy Jones | Unopposed | |||
| Unionist hold | |||||
| Party | Candidate | Votes | % | ±% | |
|---|---|---|---|---|---|
| C | Unionist | Kennedy Jones | Unopposed | ||
| Unionist hold | |||||
| C indicates candidate endorsed by the coalition government. | |||||
Elections in the 1920s
| Party | Candidate | Votes | % | ±% | |
|---|---|---|---|---|---|
| Unionist | William Ward | 15,959 | 53.4 | N/A | |
| Liberal | Leslie Burgin | 13,943 | 46.6 | New | |
| Majority | 2,016 | 6.8 | N/A | ||
| Turnout | 29,902 | 65.7 | N/A | ||
| Registered electors | 45,510 | ||||
| Unionist hold | Swing | N/A | |||
| Party | Candidate | Votes | % | ±% | |
|---|---|---|---|---|---|
| Unionist | William Ward | 18,462 | 53.2 | N/A | |
| Liberal | Leslie Burgin | 16,239 | 46.8 | N/A | |
| Majority | 2,223 | 6.4 | N/A | ||
| Turnout | 34,701 | 77.2 | N/A | ||
| Registered electors | 44,964 | ||||
| Unionist hold | Swing | N/A | |||
| Party | Candidate | Votes | % | ±% | |
|---|---|---|---|---|---|
| Unionist | William Ward | 16,812 | 47.4 | −5.8 | |
| Liberal | Leslie Burgin | 15,197 | 42.8 | −4.0 | |
| Labour | Christopher Francis Healy | 3,487 | 9.8 | New | |
| Majority | 1,615 | 4.6 | −1.8 | ||
| Turnout | 35,496 | 76.6 | −0.6 | ||
| Registered electors | 46,312 | ||||
| Unionist hold | Swing | −0.9 | |||
| Party | Candidate | Votes | % | ±% | |
|---|---|---|---|---|---|
| Unionist | Euan Wallace | 21,017 | 54.6 | +7.2 | |
| Liberal | Leslie Burgin | 13,217 | 34.3 | −8.5 | |
| Labour | Christopher Francis Healy | 4,277 | 11.1 | +1.3 | |
| Majority | 7,800 | 20.3 | +15.7 | ||
| Turnout | 38,511 | 81.6 | +5.0 | ||
| Registered electors | 47,174 | ||||
| Unionist hold | Swing | +7.9 | |||
| Party | Candidate | Votes | % | ±% | |
|---|---|---|---|---|---|
| Unionist | Euan Wallace | 25,540 | 51.0 | −3.6 | |
| Liberal | William Thomson | 16,029 | 32.0 | −2.3 | |
| Labour | Francis Henry Wiltshire | 8,529 | 17.0 | +5.9 | |
| Majority | 9,511 | 19.0 | −1.3 | ||
| Turnout | 50,098 | 75.2 | −6.4 | ||
| Registered electors | 66,620 | ||||
| Unionist hold | Swing | −0.7 | |||
Elections in the 1930s
| Party | Candidate | Votes | % | ±% | |
|---|---|---|---|---|---|
| Conservative | Euan Wallace | 41,194 | 84.5 | +33.5 | |
| Labour | Hugh Franklin | 7,585 | 15.5 | -2.0 | |
| Majority | 33,609 | 69.0 | +50.0 | ||
| Turnout | 48,779 | 70.3 | -4.9 | ||
| Conservative hold | Swing | ||||
| Party | Candidate | Votes | % | ±% | |
|---|---|---|---|---|---|
| Conservative | Euan Wallace | 30,494 | 64.9 | -19.6 | |
| Labour | Mari Power | 10,320 | 21.9 | +6.4 | |
| Liberal | Herbert Baxter | 6,206 | 13.2 | New | |
| Majority | 20,174 | 43.0 | -26.0 | ||
| Turnout | 47,020 | 67.0 | +3.3 | ||
| Conservative hold | Swing | ||||
General Election 1939–40:
Another General Election was required to take place before the end of 1940. The political parties had been making preparations for an election to take place and by the Autumn of 1939, the following candidates had been selected;
- Conservative: Euan Wallace
- Labour: JT Murphy
Elections in the 1940s
| Party | Candidate | Votes | % | ±% | |
|---|---|---|---|---|---|
| Conservative | David Gammans | 11,077 | 72.8 | +7.9 | |
| National | Noel Pemberton Billing | 4,146 | 27.2 | New | |
| Majority | 6,931 | 45.6 | +2.6 | ||
| Turnout | 15,223 | 21.1 | -45.9 | ||
| Conservative hold | Swing | ||||
| Party | Candidate | Votes | % | ±% | |
|---|---|---|---|---|---|
| Conservative | David Gammans | 24,684 | 52.8 | -12.1 | |
| Labour | Bill Fiske | 12,015 | 25.7 | +3.8 | |
| Communist | George John Jones | 10,058 | 21.5 | New | |
| Majority | 12,669 | 27.1 | -15.9 | ||
| Turnout | 46,757 | 73.1 | +6.1 | ||
| Conservative hold | Swing | ||||
Elections in the 1950s
| Party | Candidate | Votes | % | ±% | |
|---|---|---|---|---|---|
| Conservative | David Gammans | 33,927 | 53.8 | +1.0 | |
| Labour | Reginald Pestell | 22,832 | 36.2 | +10.5 | |
| Liberal | Adrienne Leevers | 5,122 | 8.1 | New | |
| Communist | George John Jones | 1,191 | 1.9 | -19.6 | |
| Majority | 11,095 | 17.6 | -9.5 | ||
| Turnout | 63,072 | ||||
| Conservative hold | Swing | ||||
- Archive footage of the result and speeches from 3:57: https://www.youtube.com/watch?v=yTmt5Rz-DTA
| Party | Candidate | Votes | % | ±% | |
|---|---|---|---|---|---|
| Conservative | David Gammans | 36,417 | 58.7 | +4.9 | |
| Labour | Reginald Pestell | 25,643 | 41.3 | +5.1 | |
| Majority | 10,774 | 17.4 | -0.2 | ||
| Turnout | 62,060 | ||||
| Conservative hold | Swing | ||||
| Party | Candidate | Votes | % | ±% | |
|---|---|---|---|---|---|
| Conservative | David Gammans | 33,294 | 60.2 | +1.5 | |
| Labour | Frederick Evelyn Mostyn | 20,568 | 37.2 | -4.1 | |
| Communist | George John Jones | 1,442 | 2.6 | New | |
| Majority | 12,726 | 23.0 | +5.6 | ||
| Turnout | 55,304 | ||||
| Conservative hold | Swing | ||||
| Party | Candidate | Votes | % | ±% | |
|---|---|---|---|---|---|
| Conservative | Muriel Gammans | 24,169 | 53.5 | -6.7 | |
| Labour | Frederick Evelyn Mostyn | 21,038 | 46.5 | +9.3 | |
| Majority | 3,131 | 7.0 | -16.0 | ||
| Turnout | 45,207 | ||||
| Conservative hold | Swing | -8.0 | |||
| Party | Candidate | Votes | % | ±% | |
|---|---|---|---|---|---|
| Conservative | Muriel Gammans | 30,048 | 55.06 | ||
| Labour | Frederick Evelyn Mostyn | 17,710 | 32.45 | ||
| Liberal | Samuel Solomon | 5,706 | 10.46 | New | |
| Communist | George John Jones | 1,107 | 2.03 | ||
| Majority | 12,338 | 22.61 | - | ||
| Turnout | 54,571 | ||||
| Conservative hold | Swing | ||||
Elections in the 1960s
| Party | Candidate | Votes | % | ±% | |
|---|---|---|---|---|---|
| Conservative | Muriel Gammans | 22,590 | 46.68 | -8.38 | |
| Labour | C Stephen Yeo | 18,528 | 38.29 | +5.84 | |
| Liberal | Samuel Solomon | 6,015 | 12.43 | +1.97 | |
| Communist | Max Morris | 1,258 | 2.60 | +0.57 | |
| Majority | 4,062 | 8.39 | -14.22 | ||
| Turnout | 48,391 | 70.45 | -6.25 | ||
| Conservative hold | Swing | -7.11 | |||
| Party | Candidate | Votes | % | ±% | |
|---|---|---|---|---|---|
| Conservative | Hugh Rossi | 21,116 | 44.15 | -2.53 | |
| Labour | C Stephen Yeo | 20,501 | 42.86 | +4.57 | |
| Liberal | Percy W Meyer | 5,026 | 10.51 | -1.92 | |
| Communist | Max Morris | 1,184 | 2.48 | -0.12 | |
| Majority | 615 | 1.29 | -7.10 | ||
| Turnout | 47,827 | 72.75 | +2.30 | ||
| Conservative hold | Swing | -3.55 | |||
Elections in the 1970s
| Party | Candidate | Votes | % | ±% | |
|---|---|---|---|---|---|
| Conservative | Hugh Rossi | 21,434 | 49.14 | +4.99 | |
| Labour | Philip Wells-Pestell | 17,645 | 40.46 | -2.40 | |
| Liberal | Laurence S Brass | 3,755 | 8.61 | -1.9 | |
| Communist | Margaret Morris | 624 | 1.43 | -1.05 | |
| Socialist (GB) | Edmund Grant | 156 | 0.36 | New | |
| Majority | 3,789 | 8.68 | +7.39 | ||
| Turnout | 43,614 | 67.37 | |||
| Conservative hold | Swing | ||||
| Party | Candidate | Votes | % | ±% | |
|---|---|---|---|---|---|
| Conservative | Hugh Rossi | 18,792 | 42.66 | -6.48 | |
| Labour | Irving Howard Kuczynski | 16,584 | 37.65 | -2.81 | |
| Liberal | Patrick William O'Brien | 8,676 | 19.69 | +11.09 | |
| Majority | 2,208 | 5.01 | -3.68 | ||
| Turnout | 44,052 | 75.96 | +8.59 | ||
| Conservative hold | Swing | ||||
| Party | Candidate | Votes | % | ±% | |
|---|---|---|---|---|---|
| Conservative | Hugh Rossi | 17,226 | 43.14 | +0.49 | |
| Labour | Irving Howard Kuczynski | 16,444 | 41.19 | +3.54 | |
| Liberal | Philip Laurence Smulian | 5,283 | 13.23 | -6.46 | |
| National Front | Jennifer Stubbs | 973 | 2.44 | New | |
| Majority | 782 | 1.95 | -3.06 | ||
| Turnout | 39,926 | 68.52 | -7.44 | ||
| Conservative hold | Swing | -1.53 | |||
| Party | Candidate | Votes | % | ±% | |
|---|---|---|---|---|---|
| Conservative | Hugh Rossi | 20,225 | 49.37 | +6.23 | |
| Labour | Edward Robert Knight (Ted Knight) | 16,188 | 39.52 | -1.67 | |
| Liberal | Patrick William O'Brien | 4,058 | 9.91 | -3.32 | |
| National Front | Bruce William Pell | 337 | 0.82 | -1.61 | |
| Ind. Conservative | Derek Walter Berry | 156 | 0.38 | New | |
| Majority | 4,037 | 9.85 | +7.90 | ||
| Turnout | 40,964 | 70.13 | +1.61 | ||
| Conservative hold | Swing | +3.95 | |||