Greenhouse gas
Greenhouse gases are the gases in the atmosphere that raise the surface temperature of planets such as the Earth. What distinguishes them from other gases is that they absorb the wavelengths of radiation that a planet emits, resulting in the greenhouse effect. The Earth is warmed by sunlight, causing its surface to radiate heat, which is then mostly absorbed by water vapor (H2O), carbon dioxide (CO2), methane (CH4), nitrous oxide (N2O), and ozone (O3). Without greenhouse gases, the average temperature of Earth's surface would be about −18 °C (0 °F), rather than the present average of 15 °C (59 °F).

Human activities since the beginning of the Industrial Revolution (around 1750) have increased atmospheric methane concentrations by over 150% and carbon dioxide by over 50%, up to a level not seen in over 3 million years. Carbon dioxide is causing about three quarters of global warming and can take thousands of years to be fully absorbed by the carbon cycle. Methane causes most of the remaining warming and lasts in the atmosphere for an average of 12 years.
The vast majority of carbon dioxide emissions by humans come from the combustion of fossil fuels, principally coal, petroleum (including oil) and natural gas. Additional contributions come from cement manufacturing, fertilizer production, and changes in land use like deforestation. Methane emissions originate from agriculture, fossil fuel production, waste, and other sources.
According to Berkeley Earth, average global surface temperature has risen by more than 1.2 °C (2.2 °F) since the pre-industrial (1850–1899) period as a result of greenhouse gas emissions. If current emission rates continue then temperature rises will surpass 2.0 °C (3.6 °F) sometime between 2040 and 2070, which is the level the United Nations' Intergovernmental Panel on Climate Change (IPCC) says is "dangerous".
Definition
Greenhouse gases are infrared active gases that absorb and emit infrared radiation in the wavelength range emitted by Earth. Carbon dioxide (0.04%), nitrous oxide, methane, and ozone are trace gases that account for almost 0.1% of Earth's atmosphere and have an appreciable greenhouse effect.
A formal definition of greenhouses gases is as follows: "Gaseous constituents of the atmosphere, both natural and anthropogenic, that absorb and emit radiation at specific wavelengths within the spectrum of radiation emitted by the Earth's surface, by the atmosphere itself, and by clouds. This property causes the greenhouse effect." The radiation emitted by the Earth's surface, the atmosphere and clouds is called thermal infrared or longwave radiation.
List of most abundant greenhouse gases
The most abundant greenhouse gases in Earth's atmosphere, listed in decreasing order of average global mole fraction, are:
-
Water vapor (H
2O) -
Carbon dioxide (CO
2) -
Methane (CH
4) -
Nitrous oxide (N
2O) -
Ozone (O
3) - Chlorofluorocarbons (CFCs and HCFCs)
- Hydrofluorocarbons (HFCs)
-
Perfluorocarbons (CF
4, C
2F
6, etc.), SF
6, and NF
3
Water vapor is a potent greenhouse gas but not one that humans are directly adding to. It is therefore not one of the drivers of climate change that the IPCC (Intergovernmental Panel on Climate Change) is concerned with, and therefore not included in the IPCC list of greenhouse gases. Changes in water vapor is a feedback that impacts climate sensitivity in complicated ways (because of clouds mostly).
Properties

Most gases whose molecules have two different atoms (such as carbon monoxide, CO), and all gasses with three or more atoms (including H2O and CO2), are infrared active and act as greenhouse gases. Technically, this is because an asymmetry in the molecule's electric charge distribution allows molecular vibrations to interact with electromagnetic radiation.
Gasses with only one atom (such as argon, Ar) or with two identical atoms (such as nitrogen, N
2, and oxygen, O
2) are not infrared active. They are transparent to thermal radiation, and, for practical purposes, do not absorb or emit thermal radiation.
This is because monatomic gases such as Ar do not have vibrational modes, and molecules containing two atoms of the same element such as N
2 and O
2 have no asymmetry in the distribution of their electrical charges when they vibrate. Hence they are almost totally unaffected by infrared thermal radiation. N
2 and O
2 are able to absorb and emit very small amounts of infrared thermal radiation as a result of collision-induced absorption. However, even taking relative abundances into account, this effect is small compared to the influences of Earth's major greenhouse gases.
The major constituents of Earth's atmosphere, nitrogen (N
2) (78%), oxygen (O
2) (21%), and argon (Ar) (0.9%), are not infrared active and so are not greenhouse gases. These gases make up more than 99% of the dry atmosphere.
Global warming potential (GWP) and CO2 equivalents

Global warming potential (GWP) is an index to measure of how much infrared thermal radiation a greenhouse gas would absorb over a given time frame after it has been added to the atmosphere (or emitted to the atmosphere). The GWP makes different greenhouse gases comparable with regards to their "effectiveness in causing radiative forcing". It is expressed as a multiple of the radiation that would be absorbed by the same mass of added carbon dioxide (CO2), which is taken as a reference gas. Therefore, the GWP is one for CO2. For other gases it depends on how strongly the gas absorbs infrared thermal radiation, how quickly the gas leaves the atmosphere, and the time frame being considered.
For example, methane has a GWP over 20 years (GWP-20) of 81.2 meaning that, for example, a leak of a tonne of methane is equivalent to emitting 81.2 tonnes of carbon dioxide measured over 20 years. As methane has a much shorter atmospheric lifetime than carbon dioxide, its GWP is much less over longer time periods, with a GWP-100 of 27.9 and a GWP-500 of 7.95.
The carbon dioxide equivalent (CO2e or CO2eq or CO2-e) can be calculated from the GWP. For any gas, it is the mass of CO2 that would warm the earth as much as the mass of that gas. Thus it provides a common scale for measuring the climate effects of different gases. It is calculated as GWP times mass of the other gas.Sources
Natural sources
Most greenhouse gases have both natural and human-caused sources. An exception are purely human-produced synthetic halocarbons which have no natural sources. During the pre-industrial Holocene, concentrations of existing gases were roughly constant, because the large natural sources and sinks roughly balanced. In the industrial era, human activities have added greenhouse gases to the atmosphere, mainly through the burning of fossil fuels and clearing of forests.
Greenhouse gas emissions from human activities
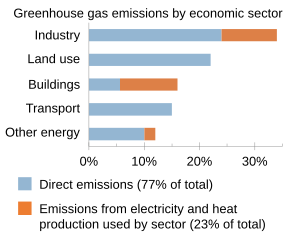
The major anthropogenic (human origin) sources of greenhouse gases are carbon dioxide (CO2), nitrous oxide (N
2O), methane, three groups of fluorinated gases (sulfur hexafluoride (SF
6), hydrofluorocarbons (HFCs) and perfluorocarbons (PFCs, sulphur hexafluoride (SF6), and nitrogen trifluoride (NF3)). Though the greenhouse effect is heavily driven by water vapor, human emissions of water vapor are not a significant contributor to warming.
Water vapor

Water vapor accounts for the largest percentage of the greenhouse effect, between 36% and 66% for clear sky conditions and between 66% and 85% when including clouds. Water vapor concentrations fluctuate regionally, but human activity does not directly affect water vapor concentrations except at local scales, such as near irrigated fields. Indirectly, human activity that increases global temperatures will increase water vapor concentrations, a process known as water vapor feedback. The atmospheric concentration of vapor is highly variable and depends largely on temperature, from less than 0.01% in extremely cold regions up to 3% by mass in saturated air at about 32 °C. (See Relative humidity#Other important facts.)
The average residence time of a water molecule in the atmosphere is only about nine days, compared to years or centuries for other greenhouse gases such as CH
4 and CO2. Water vapor responds to and amplifies effects of the other greenhouse gases. The Clausius–Clapeyron relation establishes that more water vapor will be present per unit volume at elevated temperatures. This and other basic principles indicate that warming associated with increased concentrations of the other greenhouse gases also will increase the concentration of water vapor (assuming that the relative humidity remains approximately constant; modeling and observational studies find that this is indeed so). Because water vapor is a greenhouse gas, this results in further warming and so is a "positive feedback" that amplifies the original warming. Current estimates (as of 2000) suggest that water vapor feedback has a "gain" coefficient of about 0.4; a gain coefficient must be 1 or greater to create an unstable feedback loop of the sort that could stimulate runaway warming. Thus, although water vapor feedback amplifies the impact of temperature changes caused by other factors, there is no indication that Earth is involved in a runaway greenhouse effect of the sort that could lead to Venus-like conditions.
Role in radiative forcing and greenhouse effect
Effects on air and surface
Absorption and emission of thermal radiation by greenhouse gases plays a role in heat transport in the air and at the surface:
- Atmospheric cooling: Greenhouse gases emit more thermal radiation than they absorb, and so have an overall cooling effect on air.
- Inhibition of radiative surface cooling: Greenhouse gases limit radiative heat flow away from the surface and within the lower atmosphere. Greenhouse gases exchange thermal radiation with the surface, reducing the overall rate of upward radiative heat transfer.
Naming these effects contributes to a full understanding of the role of greenhouse gases. However, these effects are of secondary importance when it comes to understanding global warming. It is important to focus on top-of-atmosphere energy balance in order to correctly reason about global warming. It has been argued that the surface budget fallacy, in which focus on the surface energy budget leads to faulty reasoning, constitutes a common fallacy when thinking about the greenhouse effect and global warming.
Effect at top-of-atmosphere (TOA)
At the top of the atmosphere (TOA), absorbing and emission of thermal radiation by greenhouse gases leads to inhibition of radiative cooling to space, which means the amount of thermal radiation reaching space is reduced, relative to what is emitted by the surface. The change in TOA energy balance leads to the surface accumulating thermal energy and warming until TOA energy balance is achieved.
Radiative forcing
Radiative forcing is a metric that characterizes the impact of an external change in a factor that influences climate, e.g., a change in the concentration of greenhouse gases, or the effect of a volcanic eruption. The radiative forcing associated with a change is calculated as the change in the top-of-atmosphere (TOA) energy balance that would be caused by the external change, if one imagined that the change could be made without giving the troposphere or surface time to respond to reduce the imbalance. A positive forcing indicates more energy arriving than leaving. The term radiative forcing has been used inconsistently in the scientific literature.
Increasing the concentration of greenhouse gases is associated with a positive radiative forcing. Increasing the concentration of greenhouse gases tends to increase the TOA energy imbalance, leading to additional warming.
The major non-gas contributor to Earth's greenhouse effect, clouds, also absorb and emit infrared radiation and thus have an effect on greenhouse gas radiative properties. Clouds are water droplets or ice crystals suspended in the atmosphere.

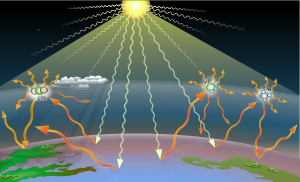
Earth absorbs some of the radiant energy received from the sun, reflects some of it as light and reflects or radiates the rest back to space as heat. A planet's surface temperature depends on this balance between incoming and outgoing energy. When Earth's energy balance is shifted, its surface becomes warmer or cooler, leading to a variety of changes in global climate.
A number of natural and human-made mechanisms can affect the global energy balance and force changes in Earth's climate. Greenhouse gases are one such mechanism. Greenhouse gases absorb and emit some of the outgoing energy radiated from Earth's surface, causing that heat to be retained in the lower atmosphere. Some greenhouse gases remain in the atmosphere for decades or even centuries such as Nitrous oxide and Fluorinated gases, and therefore can affect Earth's energy balance over a long period. Radiative forcing quantifies (in Watts per square meter) the effect of factors that influence Earth's energy balance; including changes in the concentrations of greenhouse gases. Positive radiative forcing leads to warming by increasing the net incoming energy, whereas negative radiative forcing leads to cooling, as with anti-greenhouse effects causing gases like sulfur dioxide.
Chemical process contributions to radiative forcing

Some gases contribute indirectly to altering the TOA radiative balance through participation in chemical processes within the atmosphere.
Oxidation of CO to CO2 directly produces an unambiguous increase in radiative forcing although the reason is subtle. The peak of the thermal IR emission from Earth's surface is very close to a strong vibrational absorption band of CO2 (wavelength 15 microns, or wavenumber 667 cm−1). On the other hand, the single CO vibrational band only absorbs IR at much shorter wavelengths (4.7 microns, or 2145 cm−1), where the emission of radiant energy from Earth's surface is at least a factor of ten lower. Oxidation of methane to CO2, which requires reactions with the OH radical, produces an instantaneous reduction in radiative absorption and emission since CO2 is a weaker greenhouse gas than methane. However, the oxidations of CO and CH
4 are entwined since both consume OH radicals. In any case, the calculation of the total radiative effect includes both direct and indirect forcing.
A second type of indirect effect happens when chemical reactions in the atmosphere involving these gases change the concentrations of greenhouse gases. For example, the destruction of non-methane volatile organic compounds (NMVOCs) in the atmosphere can produce ozone. The size of the indirect effect can depend strongly on where and when the gas is emitted.
NMVOCs include a large variety of chemically different compounds, such as benzene, ethanol, formaldehyde, cyclohexane, 1,1,1-trichloroethane and acetone. Essentially, NMVOCs are identical to volatile organic compounds (VOCs), but with methane excluded. Methane is excluded in air-pollution contexts because it is not toxic. It is however a very potent greenhouse gas, with low reactivity and thus a long lifetime in the atmosphere. An important subset of NMVOCs are the non-methane hydrocarbons (NMHCs). The same process that converts NMVOCs to carbon dioxide can also lead to the formation of tropospheric ozone. Halocarbons have an indirect effect because they destroy stratospheric ozone. Finally, hydrogen can lead to ozone production and CH
4 increases as well as producing stratospheric water vapor.
Contributions of specific gases to the greenhouse effect
It is not possible to state that a certain gas causes an exact percentage of the greenhouse effect. This is because the absorption and emission bands of the gases overlap, so that the total greenhouse effect is not simply the sum of the influence of each gas. The higher ends of the ranges quoted are for each gas alone; the lower ends account for overlaps with the other gases. In addition, some gases, such as methane, are known to have large indirect effects that are still being quantified.
A water molecule only stays in the atmosphere for an average 8 to 10 days, which corresponds with high variability in the contribution from clouds and humidity at any particular time and location.
By their percentage contribution to the overall greenhouse effect on Earth, the four major greenhouse gases are:
- Water vapor (H2O), 36~72% (~75% including clouds);
- Carbon dioxide (CO2), 9~26%;
- Methane (CH4), 4~9%;
- Tropospheric ozone (O3), 3~7%.
Anthropogenic changes to the natural greenhouse effect are sometimes referred to as the enhanced greenhouse effect. The contribution of each gas to the enhanced greenhouse effect is determined by the characteristics of that gas, its abundance, and any indirect effects it may cause. For example, the direct radiative effect of a mass of methane is about 84 times stronger than the same mass of carbon dioxide over a 20-year time frame.
The most important contributions to the total greenhouse effect are shown in the following table (greenhouse gases not listed explicitly below include sulfur hexafluoride, hydrofluorocarbons and perfluorocarbons (see IPCC list of greenhouse gases).).
| K&T (1997) | Schmidt (2010) | |||
|---|---|---|---|---|
| Contributor | Clear Sky | With Clouds | Clear Sky | With Clouds |
| Water vapor | 60 | 41 | 67 | 50 |
| Clouds | 31 | 25 | ||
| CO2 | 26 | 18 | 24 | 19 |
| Tropospheric ozone (O3) | 8 | |||
| N2O + CH4 | 6 | |||
| Other | 9 | 9 | 7 | |
|
K&T (1997) used 353 ppm CO2 and calculated 125 W/m2 total clear-sky greenhouse effect; relied on single atmospheric profile and cloud model. "With Clouds" percentages are from Schmidt (2010) interpretation of K&T (1997). |
||||
Concentrations in the atmosphere
Current concentrations compared to before the Industrial Revolution

Since the beginning of the Industrial Revolution, the concentrations of many of the greenhouse gases have increased. For example, the mole fraction of carbon dioxide has increased from 280 ppm to 421 ppm, or 140 ppm over modern pre-industrial levels. The first 30 ppm increase took place in about 200 years, from the start of the Industrial Revolution to 1958; however the next 90 ppm increase took place within 56 years, from 1958 to 2014.
The concentration of a greenhouse gas is typically measured in parts per million (ppm) or parts per billion (ppb) by volume. A CO2 concentration of 420 ppm means that 420 out of every million air molecules is a CO2 molecule.
Data from 2007 showed that the concentration is increasing at a higher rate. In the 1960s, the average annual increase was only 37% of what it was in 2000 through 2007.
Many observations are available online in a variety of atmospheric chemistry observational satabases.
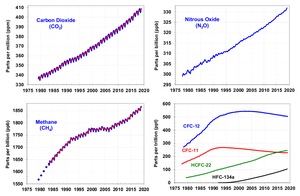
The concentrations of three important greenhouse gases changed as follows from 1750 to 2019:
- Carbon dioxide (CO2), 278.3 to 409.9 ppm, up 47%;
- Methane (CH4), 729.2 to 1866.3 ppb, up 156%;
- Nitrous oxide (N2O), 270.1 to 332.1 ppb, up 23%.
Abbreviations used in the two tables below: ppm = parts-per-million; ppb = parts-per-billion; ppt = parts-per-trillion; W/m2 = watts per square meter
| Gas | Pre-1750 tropospheric concentration |
Current tropospheric concentration (around 2011) |
Absolute increase in 2011 since 1750 |
Percentage increase in 2011 since 1750 |
Increased radiative forcing (W/m2) |
|---|---|---|---|---|---|
| Carbon dioxide (CO2) | 280 ppm | 411 ppm | 131 ppm | 47% | 2.05 |
| Methane (CH 4) |
700 ppb | 1893 ppb / 1762 ppb |
1193 ppb / 1062 ppb |
170.4% / 151.7% |
0.49 |
| Nitrous oxide (N 2O) |
270 ppb | 326 ppb / 324 ppb |
56 ppb / 54 ppb |
20.7% / 20.0% |
0.17 |
| Tropospheric ozone (O 3) |
237 ppb | 337 ppb | 100 ppb | 42% | 0.4 |
| Gas | Recent tropospheric concentration |
Increased radiative forcing (W/m2) |
|---|---|---|
|
CFC-11 (trichlorofluoromethane) (CCl 3F) |
236 ppt / 234 ppt | 0.061 |
|
CFC-12 (CCl 2F 2) |
527 ppt / 527 ppt | 0.169 |
|
CFC-113 (Cl 2FC-CClF 2) |
74 ppt / 74 ppt | 0.022 |
|
HCFC-22 (CHClF 2) |
231 ppt / 210 ppt | 0.046 |
|
HCFC-141b (CH 3CCl 2F) |
24 ppt / 21 ppt | 0.0036 |
|
HCFC-142b (CH 3CClF 2) |
23 ppt / 21 ppt | 0.0042 |
|
Halon 1211 (CBrClF 2) |
4.1 ppt / 4.0 ppt | 0.0012 |
|
Halon 1301 (CBrF 3) |
3.3 ppt / 3.3 ppt | 0.001 |
|
HFC-134a (CH 2FCF 3) |
75 ppt / 64 ppt | 0.0108 |
|
Carbon tetrachloride (CCl 4) |
85 ppt / 83 ppt | 0.0143 |
| Sulfur hexafluoride (SF 6) |
7.79 ppt / 7.39 ppt | 0.0043 |
| Other halocarbons | Varies by substance | collectively 0.02 |
| Halocarbons in total | 0.3574 |
Factors affecting concentrations
Atmospheric concentrations are determined by the balance between sources (emissions of the gas from human activities and natural systems) and sinks (the removal of the gas from the atmosphere by conversion to a different chemical compound or absorption by bodies of water).
Airborne fraction
The proportion of an emission remaining in the atmosphere after a specified time is the "airborne fraction" (AF). The annual airborne fraction is the ratio of the atmospheric increase in a given year to that year's total emissions.
As of 2006 the annual airborne fraction for CO2 was about 0.45. The annual airborne fraction increased at a rate of 0.25 ± 0.21% per year over the period 1959–2006.
Atmospheric lifetime

Aside from water vapor, which has a residence time of about nine days, major greenhouse gases are well mixed and take many years to leave the atmosphere. Although it is not easy to know with precision how long it takes greenhouse gases to leave the atmosphere, there are estimates for the principal greenhouse gases. Jacob (1999) defines the lifetime 


-
.
If input of this gas into the box ceased, then after time
The atmospheric lifetime of a species therefore measures the time required to restore equilibrium following a sudden increase or decrease in its concentration in the atmosphere. Individual atoms or molecules may be lost or deposited to sinks such as the soil, the oceans and other waters, or vegetation and other biological systems, reducing the excess to background concentrations. The average time taken to achieve this is the mean lifetime.
Carbon dioxide has a variable atmospheric lifetime, and cannot be specified precisely. Similar issues apply to other greenhouse gases, many of which have longer mean lifetimes than CO2, e.g. N2O has a mean atmospheric lifetime of 121 years.
During geologic time scales


Carbon dioxide is believed to have played an important effect in regulating Earth's temperature throughout its 4.7 billion year history. Early in the Earth's life, scientists have found evidence of liquid water indicating a warm world even though the Sun's output is believed to have only been 70% of what it is today. Higher carbon dioxide concentrations in the early Earth's atmosphere might help explain this faint young sun paradox. When Earth first formed, Earth's atmosphere may have contained more greenhouse gases and CO2 concentrations may have been higher, with estimated partial pressure as large as 1,000 kPa (10 bar), because there was no bacterial photosynthesis to reduce the gas to carbon compounds and oxygen. Methane, a very active greenhouse gas, may have been more prevalent as well.
Carbon dioxide concentrations have shown several cycles of variation from about 180 parts per million during the deep glaciations of the Holocene and Pleistocene to 280 parts per million during the interglacial periods. Carbon dioxide concentrations have varied widely over the Earth's 4.54 billion year history. It is believed to have been present in Earth's first atmosphere, shortly after Earth's formation. The second atmosphere, consisting largely of nitrogen and CO2 was produced by outgassing from volcanism, supplemented by gases produced during the late heavy bombardment of Earth by huge asteroids. A major part of carbon dioxide emissions were soon dissolved in water and incorporated in carbonate sediments.
Removal from the atmosphere
Natural processes
Carbon dioxide is removed from the atmosphere primarily through photosynthesis and enters the terrestrial and oceanic biospheres. Carbon dioxide also dissolves directly from the atmosphere into bodies of water (ocean, lakes, etc.), as well as dissolving in precipitation as raindrops fall through the atmosphere. When dissolved in water, carbon dioxide reacts with water molecules and forms carbonic acid, which contributes to ocean acidity. It can then be absorbed by rocks through weathering. It also can acidify other surfaces it touches or be washed into the ocean.
Negative emissions
A number of technologies remove greenhouse gases emissions from the atmosphere. Most widely analyzed are those that remove carbon dioxide from the atmosphere, either to geologic formations such as bio-energy with carbon capture and storage and carbon dioxide air capture, or to the soil as in the case with biochar. Many long-term climate scenario models require large-scale human-made negative emissions to avoid serious climate change. Negative emissions approaches are also being studied for atmospheric methane, called atmospheric methane removal.
History

In the late 19th century, scientists experimentally discovered that N
2 and O
2 do not absorb infrared radiation (called, at that time, "dark radiation"), while water (both as true vapor and condensed in the form of microscopic droplets suspended in clouds) and CO2 and other poly-atomic gaseous molecules do absorb infrared radiation. In the early 20th century, researchers realized that greenhouse gases in the atmosphere made Earth's overall temperature higher than it would be without them. The term greenhouse was first applied to this phenomenon by Nils Gustaf Ekholm in 1901.
During the late 20th century, a scientific consensus evolved that increasing concentrations of greenhouse gases in the atmosphere cause a substantial rise in global temperatures and changes to other parts of the climate system, with consequences for the environment and for human health.
Inventories and monitoring
The Annual Greenhouse Gas Index (AGGI) is defined by atmospheric scientists at NOAA as the ratio of total direct radiative forcing due to long-lived and well-mixed greenhouse gases for any year for which adequate global measurements exist, to that present in year 1990. These radiative forcing levels are relative to those present in year 1750 (i.e. prior to the start of the industrial era). 1990 is chosen because it is the baseline year for the Kyoto Protocol, and is the publication year of the first IPCC Scientific Assessment of Climate Change.
As such, NOAA states that the AGGI "measures the commitment that (global) society has already made to living in a changing climate. It is based on the highest quality atmospheric observations from sites around the world. Its uncertainty is very low."
Data networks
Other planets
Greenhouse gases exist in many atmospheres, creating greenhouse effects on Mars, Titan and particularly in the thick atmosphere of Venus.