Frio County, Texas
Frio County | |
|---|---|
 The Frio County Courthouse in Pearsall
| |
 Location within the U.S. state of Texas
| |
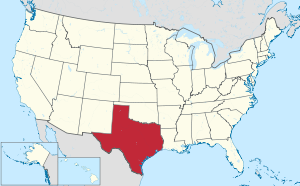 Texas's location within the U.S.
| |
| Coordinates: 28°52′N 99°07′W | |
| Country | United States |
| State | Texas |
| Founded | 1871 |
| Named for | Frio River |
| Seat | Pearsall |
| Largest city | Pearsall |
| Area | |
| • Total | 1,134 sq mi (2,940 km2) |
| • Land | 1,134 sq mi (2,940 km2) |
| • Water | 0.8 sq mi (2 km2) 0.07% |
| Population
(2020)
| |
| • Total | 18,385 |
| • Density | 15/sq mi (6/km2) |
| Time zone | UTC−6 (Central) |
| • Summer (DST) | UTC−5 (CDT) |
| Congressional district | 23rd |
| Website | www |

Frio County is a county located in the U.S. state of Texas. As of the 2020 census, its population was 18,385. The county seat is Pearsall. The county was created in 1858 and later organized in 1871. Frio is named for the Frio River, whose name is Spanish for "cold".
Geography
According to the U.S. Census Bureau, the county has a total area of 1,134 square miles (2,940 km2), of which 1,134 sq mi (2,940 km2) are land and 0.8 sq mi (2.1 km2) (0.07%) is covered by water.
Major highways
Adjacent counties
- Medina County (north)
- Atascosa County (east)
- McMullen County (southeast)
- La Salle County (south)
- Dimmit County (southwest)
- Zavala County (west)
- Uvalde County (northwest)
Demographics
| Census | Pop. | Note | %± |
|---|---|---|---|
| 1860 | 42 | — | |
| 1870 | 309 | 635.7% | |
| 1880 | 2,130 | 589.3% | |
| 1890 | 3,112 | 46.1% | |
| 1900 | 4,200 | 35.0% | |
| 1910 | 8,895 | 111.8% | |
| 1920 | 9,286 | 4.4% | |
| 1930 | 9,411 | 1.3% | |
| 1940 | 9,207 | −2.2% | |
| 1950 | 10,357 | 12.5% | |
| 1960 | 10,112 | −2.4% | |
| 1970 | 11,159 | 10.4% | |
| 1980 | 13,785 | 23.5% | |
| 1990 | 13,472 | −2.3% | |
| 2000 | 16,252 | 20.6% | |
| 2010 | 17,217 | 5.9% | |
| 2020 | 18,385 | 6.8% | |
| U.S. Decennial Census 1850–2010 2010–2014 2020 | |||
| Race | Pop 2010 | Pop 2020 | % 2010 | % 2020 |
|---|---|---|---|---|
| White (NH) | 2,796 | 3,053 | 16.24% | 16.61% |
| Black or African American (NH) | 524 | 705 | 3.04% | 3.83% |
| Native American or Alaska Native (NH) | 38 | 49 | 0.22% | 0.27% |
| Asian (NH) | 362 | 199 | 2.1% | 1.08% |
| Pacific Islander (NH) | 1 | 9 | 0.01% | 0.05% |
| Some Other Race (NH) | 29 | 81 | 0.17% | 0.44% |
| Mixed/Multi-Racial (NH) | 66 | 118 | 0.38% | 0.64% |
| Hispanic or Latino | 13,401 | 14,171 | 77.84% | 77.08% |
| Total | 17,217 | 18,385 |
As of the 2020 United States census, there were 18,385 people, 4,673 households, and 3,306 families residing in the county.
As of the census of 2000, 16,252 people, 4,743 households, and 3,642 families resided in the county. The population density was 14 people per square mile (5.4 people/km2). The 5,660 housing units averaged 5 per square mile (1.9/km2). The racial makeup of the county was 71.86% White, 4.87% Black or African American, 0.58% Native American, 0.41% Asian, 0.02% Pacific Islander, 19.76% from other races, and 2.50% from two or more races. About 73.76% of the population was Hispanic or Latino of any race.
Of the 4,743 households, 40.70% had children under the age of 18 living with them, 55.20% were married couples living together, 16.00% had a female householder with no husband present, and 23.20% were not families. About 20.60% of all households was made up of individuals, and 9.30% had someone living alone who was 65 years of age or older. The average household size was 2.98 and the average family size was 3.44.
In the county, the population was distributed as 28.70% under the age of 18, 11.20% from 18 to 24, 30.80% from 25 to 44, 18.70% from 45 to 64, and 10.60% who were 65 years of age or older. The median age was 31 years. For every 100 females, there were 121.40 males. For every 100 females age 18 and over, there were 130.20 males.
The median income for a household in the county was $24,504, and for a family was $26,578. Males had a median income of $23,810 versus $16,498 for females. The per capita income for the county was $16,069. About 24.50% of families and 29.00% of the population were below the poverty line, including 36.20% of those under age 18 and 30.40% of those age 65 or over.
Politics
| Year | Republican | Democratic | Third party | |||
|---|---|---|---|---|---|---|
| No. | % | No. | % | No. | % | |
| 2020 | 2,823 | 53.48% | 2,422 | 45.88% | 34 | 0.64% |
| 2016 | 1,856 | 42.18% | 2,444 | 55.55% | 100 | 2.27% |
| 2012 | 1,559 | 39.29% | 2,376 | 59.88% | 33 | 0.83% |
| 2008 | 1,644 | 40.47% | 2,405 | 59.21% | 13 | 0.32% |
| 2004 | 1,991 | 50.66% | 1,931 | 49.13% | 8 | 0.20% |
| 2000 | 1,774 | 42.97% | 2,317 | 56.13% | 37 | 0.90% |
| 1996 | 1,225 | 29.94% | 2,593 | 63.37% | 274 | 6.70% |
| 1992 | 1,275 | 29.52% | 2,377 | 55.04% | 667 | 15.44% |
| 1988 | 1,505 | 33.16% | 3,016 | 66.46% | 17 | 0.37% |
| 1984 | 2,003 | 42.90% | 2,656 | 56.89% | 10 | 0.21% |
| 1980 | 1,753 | 37.55% | 2,849 | 61.03% | 66 | 1.41% |
| 1976 | 1,280 | 32.75% | 2,598 | 66.48% | 30 | 0.77% |
| 1972 | 1,904 | 54.23% | 1,588 | 45.23% | 19 | 0.54% |
| 1968 | 795 | 32.69% | 1,330 | 54.69% | 307 | 12.62% |
| 1964 | 607 | 28.67% | 1,507 | 71.19% | 3 | 0.14% |
| 1960 | 713 | 39.83% | 1,068 | 59.66% | 9 | 0.50% |
| 1956 | 825 | 47.94% | 886 | 51.48% | 10 | 0.58% |
| 1952 | 1,011 | 50.52% | 983 | 49.13% | 7 | 0.35% |
| 1948 | 345 | 25.73% | 898 | 66.96% | 98 | 7.31% |
| 1944 | 293 | 21.40% | 951 | 69.47% | 125 | 9.13% |
| 1940 | 236 | 18.85% | 1,012 | 80.83% | 4 | 0.32% |
| 1936 | 193 | 15.83% | 1,019 | 83.59% | 7 | 0.57% |
| 1932 | 142 | 12.46% | 998 | 87.54% | 0 | 0.00% |
| 1928 | 673 | 72.21% | 258 | 27.68% | 1 | 0.11% |
| 1924 | 158 | 19.55% | 637 | 78.84% | 13 | 1.61% |
| 1920 | 102 | 19.17% | 421 | 79.14% | 9 | 1.69% |
| 1916 | 55 | 11.68% | 410 | 87.05% | 6 | 1.27% |
| 1912 | 25 | 5.07% | 418 | 84.79% | 50 | 10.14% |
Frio County has generally leaned Democratic, although it has sometimes voted Republican, including in 2004 and 2020.
Communities

Cities
Census-designated places
Unincorporated areas
Ghost towns
Education
School districts include:
- Charlotte Independent School District
- Devine Independent School District
- Dilley Independent School District
- Hondo Independent School District
- Pearsall Independent School District
The designated community college is Southwest Texas Junior College.