Ealing South (UK Parliament constituency)
Ealing South | |
---|---|
Former Borough constituency for the House of Commons | |
1950–February 1974 | |
Seats | one |
Created from | Ealing East |
Replaced by |
Acton (major additions to) Ealing North (minor additions to) |
Ealing South was a constituency covering the same part of the Municipal Borough of Ealing in Middlesex as its short-lived forerunner Ealing East. It returned one member (MP) to the House of Commons of the UK Parliament. It was won by two Conservatives consecutively with majorities ranging from 13.6% to 30.5%, was first contested in the general election in 1950 and was replaced before that of February 1974.
History
The constituency was created for the 1950 general election, and abolished for the February 1974 general election. In a repeat of the outcome of its direct forerunner Ealing East and its larger precursor in turn, Ealing created in 1885, it was won by the Conservative standing. The runner-up at each election was the Labour candidate, as with its predecessors since 1924 inclusive.
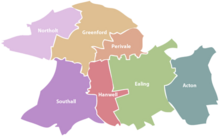
Boundaries
This was a seat covering the same parts of the Municipal Borough of Ealing in Middlesex as its short-lived forerunner Ealing East.
Throughout: the zone was fixed as the Ealing M.B., Middlesex six wards: Castlebar, Drayton, Grange Grosvenor, Lammas, Manor, and Mount Park. As to local government body from 1965 its components closely approximated to the south-central wards of the combination council, a replacement of three boroughs, the London Borough of Ealing. These were named Central, Cleveland, Northfields and Walpole.
Members of Parliament
Election | Member | Party | |
---|---|---|---|
1950 | Angus Maude | Conservative | |
1958 by-election | Brian Batsford | Conservative | |
Feb 1974 | constituency abolished |
Elections
For 1945 see Ealing East
Elections in the 1950s
Party | Candidate | Votes | % | ±% | |
---|---|---|---|---|---|
Conservative | Angus Maude | 28,299 | 56.65 | ||
Labour | J. Neary | 17,097 | 34.23 | ||
Liberal | Betty Corn | 4,555 | 9.12 | ||
Majority | 11,202 | 22.43 | |||
Turnout | 49,951 | 84.74 | |||
Registered electors | 58,944 | ||||
Conservative win (new seat) |
Party | Candidate | Votes | % | ±% | |
---|---|---|---|---|---|
Conservative | Angus Maude | 30,261 | 62.44 | +5.79 | |
Labour | David G Allen | 17,204 | 37.56 | +3.33 | |
Majority | 12,057 | 24.88 | +2.45 | ||
Turnout | 48,465 | 82.21 | -2.53 | ||
Registered electors | 58,954 | ||||
Conservative hold | Swing | +0.44 |
Party | Candidate | Votes | % | ±% | |
---|---|---|---|---|---|
Conservative | Angus Maude | 25,992 | 59.57 | -2.87 | |
Labour | David G Allen | 13,462 | 30.85 | -6.71 | |
Liberal | David E Evans | 4,182 | 9.58 | New | |
Majority | 12,530 | 28.72 | +3.84 | ||
Turnout | 43,636 | 77.86 | -4.35 | ||
Registered electors | 56,046 | ||||
Conservative hold | Swing | +1.92 |
Party | Candidate | Votes | % | ±% | |
---|---|---|---|---|---|
Conservative | Brian Batsford | 17,417 | 50.29 | -9.28 | |
Labour | Hugh Gervais Garside | 11,258 | 32.51 | +1.36 | |
Liberal | Philip Skelsey | 5,956 | 17.20 | +7.62 | |
Majority | 6,159 | 17.78 | -9.94 | ||
Turnout | 34,631 | ||||
Registered electors | |||||
Conservative hold | Swing | -5.32 |
Party | Candidate | Votes | % | ±% | |
---|---|---|---|---|---|
Conservative | Brian Batsford | 24,761 | 59.46 | -0.11 | |
Labour | Hugh Gervais Garside | 12,039 | 28.91 | -1.94 | |
Liberal | Sir Jeremy John Anthony Mostyn, 14th Baronet | 4,842 | 11.63 | +2.05 | |
Majority | 12,722 | 30.55 | +1.83 | ||
Turnout | 41,642 | 78.13 | +0.27 | ||
Registered electors | 53,296 | ||||
Conservative hold | Swing | +0.92 |
Elections in the 1960s
Party | Candidate | Votes | % | ±% | |
---|---|---|---|---|---|
Conservative | Brian Batsford | 22,121 | 61.07 | +1.61 | |
Labour | Jack J Jaffé | 14,104 | 38.93 | +10.02 | |
Majority | 8,017 | 22.13 | -8.42 | ||
Turnout | 36,225 | 70.05 | -8.08 | ||
Registered electors | 51,714 | ||||
Conservative hold | Swing | -4.21 |
Party | Candidate | Votes | % | ±% | |
---|---|---|---|---|---|
Conservative | Brian Batsford | 18,968 | 50.82 | -10.25 | |
Labour | Roderick MacFarquhar | 13,885 | 37.20 | -1.73 | |
Liberal | Barwys Niel Martin-Kaye | 4,473 | 11.98 | New | |
Majority | 5,083 | 13.62 | -8.51 | ||
Turnout | 37,326 | 72.78 | +2.73 | ||
Registered electors | 51,283 | ||||
Conservative hold | Swing | -4.26 |
Elections in the 1970s
Party | Candidate | Votes | % | ±% | |
---|---|---|---|---|---|
Conservative | Brian Batsford | 19,326 | 54.98 | +4.16 | |
Labour | Cyril Rofe | 12,042 | 34.26 | -2.94 | |
Liberal | Graham D Smith | 3,784 | 10.76 | -1.22 | |
Majority | 7,284 | 20.72 | +7.10 | ||
Turnout | 35,152 | 65.36 | -7.42 | ||
Registered electors | 53,779 | ||||
Conservative hold | Swing | +3.55 |