Ceillac
Ceillac | |
|---|---|
 A view of Ceillac from the nearby hillside
| |
 Coat of arms
| |
|
Location of Ceillac
| |
 Ceillac 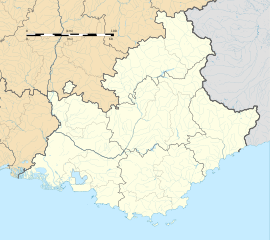 Ceillac | |
| Coordinates: 44°40′05″N 6°46′39″E | |
| Country | France |
| Region | Provence-Alpes-Côte d'Azur |
| Department | Hautes-Alpes |
| Arrondissement | Briançon |
| Canton | Guillestre |
| Intercommunality | Guillestrois et Queyras |
| Government | |
| • Mayor (2020–2026) | Emile Chabrand |
| Area 1
|
96.05 km2 (37.09 sq mi) |
| Population
(Jan. 2021)
|
277 |
| • Density | 2.9/km2 (7.5/sq mi) |
| Time zone | UTC+01:00 (CET) |
| • Summer (DST) | UTC+02:00 (CEST) |
| INSEE/Postal code |
05026 /05600 |
| Elevation | 1,224–3,381 m (4,016–11,093 ft) (avg. 1,640 m or 5,380 ft) |
| 1 French Land Register data, which excludes lakes, ponds, glaciers > 1 km2 (0.386 sq mi or 247 acres) and river estuaries. | |
Ceillac (French pronunciation: [sɛjak]; Occitan: Celhac) is a commune in the Hautes-Alpes department in southeastern France.
Geography
Climate
Ceillac has a humid continental climate (Köppen climate classification Dfb). The average annual temperature in Ceillac is 6.2 °C (43.2 °F). The average annual rainfall is 761.6 mm (29.98 in) with October as the wettest month. The temperatures are highest on average in July, at around 15.4 °C (59.7 °F), and lowest in January, at around −1.5 °C (29.3 °F). The highest temperature ever recorded in Ceillac was 31.6 °C (88.9 °F) on 27 June 2019; the coldest temperature ever recorded was −24.0 °C (−11.2 °F) on 10 February 1986.
| Climate data for Ceillac (1981–2010 averages, extremes 1951−present) | |||||||||||||
|---|---|---|---|---|---|---|---|---|---|---|---|---|---|
| Month | Jan | Feb | Mar | Apr | May | Jun | Jul | Aug | Sep | Oct | Nov | Dec | Year |
| Record high °C (°F) | 14.5 (58.1) |
16.5 (61.7) |
19.5 (67.1) |
22.5 (72.5) |
25.0 (77.0) |
31.6 (88.9) |
31.0 (87.8) |
29.7 (85.5) |
29.3 (84.7) |
24.0 (75.2) |
20.2 (68.4) |
16.7 (62.1) |
31.6 (88.9) |
| Mean daily maximum °C (°F) | 3.0 (37.4) |
3.8 (38.8) |
6.7 (44.1) |
9.3 (48.7) |
14.0 (57.2) |
18.2 (64.8) |
21.7 (71.1) |
21.1 (70.0) |
16.8 (62.2) |
12.0 (53.6) |
6.5 (43.7) |
3.3 (37.9) |
11.4 (52.5) |
| Daily mean °C (°F) | −1.5 (29.3) |
−1.2 (29.8) |
1.6 (34.9) |
4.2 (39.6) |
8.7 (47.7) |
12.3 (54.1) |
15.4 (59.7) |
15.0 (59.0) |
11.3 (52.3) |
7.2 (45.0) |
2.2 (36.0) |
−0.8 (30.6) |
6.2 (43.2) |
| Mean daily minimum °C (°F) | −6.0 (21.2) |
−6.2 (20.8) |
−3.5 (25.7) |
−0.9 (30.4) |
3.4 (38.1) |
6.5 (43.7) |
9.1 (48.4) |
8.9 (48.0) |
5.7 (42.3) |
2.4 (36.3) |
−2.1 (28.2) |
−4.9 (23.2) |
1.1 (34.0) |
| Record low °C (°F) | −22.0 (−7.6) |
−24.0 (−11.2) |
−23.0 (−9.4) |
−14.0 (6.8) |
−15.0 (5.0) |
−6.0 (21.2) |
−2.0 (28.4) |
−2.0 (28.4) |
−4.0 (24.8) |
−10.0 (14.0) |
−16.0 (3.2) |
−21.0 (−5.8) |
−24.0 (−11.2) |
| Average precipitation mm (inches) | 47.7 (1.88) |
38.0 (1.50) |
45.0 (1.77) |
72.6 (2.86) |
69.9 (2.75) |
84.3 (3.32) |
56.0 (2.20) |
63.3 (2.49) |
75.9 (2.99) |
86.0 (3.39) |
63.7 (2.51) |
59.2 (2.33) |
761.6 (29.98) |
| Average precipitation days (≥ 1.0 mm) | 6.5 | 5.6 | 6.5 | 8.9 | 9.8 | 9.5 | 6.7 | 7.4 | 6.6 | 8.5 | 7.1 | 7.4 | 90.6 |
| Source: Meteociel | |||||||||||||
Population
| Year | Pop. | ±% p.a. |
|---|---|---|
| 1968 | 208 | — |
| 1975 | 234 | +1.70% |
| 1982 | 292 | +3.21% |
| 1990 | 289 | −0.13% |
| 1999 | 276 | −0.51% |
| 2007 | 297 | +0.92% |
| 2012 | 298 | +0.07% |
| 2017 | 292 | −0.41% |
| Source: INSEE | ||