Cascade County, Montana
Cascade County | |
|---|---|
 Cascade County Courthouse
| |
 Location within the U.S. state of Montana
| |
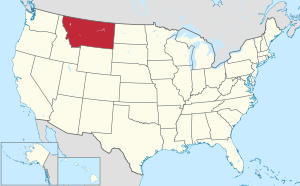 Montana's location within the U.S.
| |
| Coordinates: 47°19′N 111°21′W | |
| Country | United States |
| State | Montana |
| Founded | 1887 |
| Named for | Great Falls of the Missouri River |
| Seat | Great Falls |
| Largest city | Great Falls |
| Area | |
| • Total | 2,711 sq mi (7,020 km2) |
| • Land | 2,698 sq mi (6,990 km2) |
| • Water | 13 sq mi (30 km2) 0.5% |
| Population
(2020)
| |
| • Total | 84,414 |
| • Estimate (2022)
|
84,864 |
| • Density | 31/sq mi (12/km2) |
| Time zone | UTC−7 (Mountain) |
| • Summer (DST) | UTC−6 (MDT) |
| Congressional district | 2nd |
| Website | www |
| |

Cascade County (cascade means waterfall in French) is a county located in the U.S. state of Montana. As of the 2020 census, the population was 84,414, making it the fifth-most populous county in Montana. Its county seat is Great Falls.
Cascade County comprises the Great Falls, MT Metropolitan Statistical Area.
History
At the time of the Lewis and Clark Expedition, Cascade County was the territory of the Blackfeet. The county was named for the falls on the Missouri River.
The United States Army at one time had Fort Shaw as an outpost in the northwest part of the county. Only a small settlement is left by that name, a CDP.
Geography
According to the United States Census Bureau, the county has a total area of 2,711 square miles (7,020 km2), of which 2,698 square miles (6,990 km2) is land and 13 square miles (34 km2) (0.5%) is water. The Missouri River and the Sun River flow through the county, and meet at the city of Great Falls. A portion of the Adel Mountains Volcanic Field is in the southwest corner of the county. The Rocky Mountains are in the western part of the county with the Little Belt and Highwood Mountains in the southeast.
Adjacent counties
- Teton County - northwest
- Chouteau County - northeast
- Judith Basin County - east
- Meagher County - south
- Lewis and Clark County - west
National protected areas
Demographics
| Census | Pop. | Note | %± |
|---|---|---|---|
| 1890 | 8,755 | — | |
| 1900 | 25,777 | 194.4% | |
| 1910 | 28,833 | 11.9% | |
| 1920 | 38,836 | 34.7% | |
| 1930 | 41,146 | 5.9% | |
| 1940 | 41,199 | 0.1% | |
| 1950 | 53,027 | 28.7% | |
| 1960 | 73,418 | 38.5% | |
| 1970 | 81,804 | 11.4% | |
| 1980 | 80,696 | −1.4% | |
| 1990 | 77,691 | −3.7% | |
| 2000 | 80,357 | 3.4% | |
| 2010 | 81,327 | 1.2% | |
| 2020 | 84,414 | 3.8% | |
| 2022 (est.) | 84,864 | 0.5% | |
| U.S. Decennial Census 1790-1960 1900-1990 1990-2000 2010-2020 | |||
2020 census
As of the census of 2020, there were 84,414 people.
2010 census
As of the census of 2010, there were 81,327 people, 33,809 households, and 21,403 families living in the county. The population density was 30.1 inhabitants per square mile (11.6/km2). There were 37,276 housing units at an average density of 13.8 per square mile (5.3/km2). The racial makeup of the county was 89.2% white, 4.3% American Indian, 1.2% black or African American, 0.8% Asian, 0.1% Pacific islander, 0.6% from other races, and 3.6% from two or more races. Those of Hispanic or Latino origin made up 3.3% of the population. In terms of ancestry, 28.5% were German, 17.1% were Irish, 12.3% were English, 10.3% were Norwegian, and 4.5% were American.
Of the 33,809 households, 29.8% had children under the age of 18 living with them, 48.4% were married couples living together, 10.2% had a female householder with no husband present, 36.7% were non-families, and 30.5% of all households were made up of individuals. The average household size was 2.33 and the average family size was 2.90. The median age was 38.9 years.
The median income for a household in the county was $42,389 and the median income for a family was $53,540. Males had a median income of $37,904 versus $27,944 for females. The per capita income for the county was $22,963. About 10.9% of families and 13.5% of the population were below the poverty line, including 20.4% of those under age 18 and 8.8% of those age 65 or over.
Politics
Like Lewis & Clark County to the west, Cascade County leans Republican but has voted for Democrats four times since Lyndon Johnson's landslide in 1964. Hubert Humphrey easily won this county in 1968, one of nine counties that he was able to win. Barack Obama carried Cascade in 2008 but lost to Mitt Romney in 2012 by 9%. Since 2012, the county has voted Republican by comfortable margins. In 2020, Donald Trump won the county with over 58% of the vote, the best performance by a Republican since 1920.
In statewide races, Cascade County often acts as a bellwether county and has been friendlier to Democrats - Senators Max Baucus and Jon Tester have carried the county in all of their elections and Governors Brian Schweitzer and Steve Bullock carried it in all four elections in 2004–2016. Since at least 1984, no Democrat has won in Montana without winning Cascade County, however, Republicans have occasionally won statewide without carrying the county, such as former Senator Conrad Burns in 1988 and 2000, Governors Marc Racicot in 1992 and Judy Martz in 2000, Secretaries of State Bob Brown in 2000 and Brad Johnson in 2004, and Attorney General Tim Fox in 2012.
| Year | Republican | Democratic | Third party | |||
|---|---|---|---|---|---|---|
| No. | % | No. | % | No. | % | |
| 2020 | 23,315 | 58.46% | 15,456 | 38.75% | 1,114 | 2.79% |
| 2016 | 19,632 | 56.79% | 12,175 | 35.22% | 2,764 | 8.00% |
| 2012 | 18,345 | 53.06% | 15,232 | 44.05% | 999 | 2.89% |
| 2008 | 16,857 | 47.62% | 17,664 | 49.90% | 875 | 2.47% |
| 2004 | 19,028 | 56.87% | 13,701 | 40.95% | 730 | 2.18% |
| 2000 | 18,164 | 54.52% | 13,137 | 39.43% | 2,016 | 6.05% |
| 1996 | 14,291 | 40.82% | 15,707 | 44.87% | 5,008 | 14.31% |
| 1992 | 12,494 | 34.16% | 14,719 | 40.24% | 9,365 | 25.60% |
| 1988 | 15,946 | 49.64% | 15,718 | 48.93% | 460 | 1.43% |
| 1984 | 19,846 | 57.52% | 14,252 | 41.30% | 407 | 1.18% |
| 1980 | 17,664 | 54.80% | 11,105 | 34.45% | 3,465 | 10.75% |
| 1976 | 15,289 | 50.11% | 14,678 | 48.11% | 544 | 1.78% |
| 1972 | 16,159 | 52.40% | 12,899 | 41.83% | 1,778 | 5.77% |
| 1968 | 11,588 | 43.23% | 13,507 | 50.39% | 1,708 | 6.37% |
| 1964 | 8,986 | 33.64% | 17,609 | 65.92% | 119 | 0.45% |
| 1960 | 11,928 | 45.72% | 14,117 | 54.11% | 45 | 0.17% |
| 1956 | 12,455 | 52.88% | 11,098 | 47.12% | 0 | 0.00% |
| 1952 | 12,176 | 52.09% | 11,051 | 47.28% | 146 | 0.62% |
| 1948 | 6,830 | 34.47% | 12,082 | 60.97% | 905 | 4.57% |
| 1944 | 6,372 | 36.54% | 10,924 | 62.65% | 141 | 0.81% |
| 1940 | 6,443 | 31.70% | 13,637 | 67.10% | 244 | 1.20% |
| 1936 | 4,077 | 22.92% | 13,325 | 74.91% | 387 | 2.18% |
| 1932 | 5,800 | 34.48% | 10,047 | 59.72% | 976 | 5.80% |
| 1928 | 8,183 | 55.08% | 6,540 | 44.02% | 133 | 0.90% |
| 1924 | 5,081 | 43.41% | 2,220 | 18.96% | 4,405 | 37.63% |
| 1920 | 6,808 | 58.83% | 3,938 | 34.03% | 826 | 7.14% |
| 1916 | 3,253 | 30.57% | 6,612 | 62.14% | 776 | 7.29% |
| 1912 | 1,079 | 23.72% | 1,633 | 35.90% | 1,837 | 40.38% |
| 1908 | 1,935 | 44.86% | 1,888 | 43.77% | 490 | 11.36% |
| 1904 | 2,405 | 55.34% | 1,385 | 31.87% | 556 | 12.79% |
Economy
Malmstrom Air Force Base is a driving force in the regional economy. In 2009, Benefis, Great Falls Clinic, National Electronics Warranty and Walmart were the largest private employers.
Education
Apollos University, The University of Great Falls, and the MSU College of Technology - Great Falls are both located in Great Falls.
K-12 education
Public school districts include:
Secondary:
- Belt High School District
- Cascade High School District
- Great Falls High School District
- Simms High School District
- Centerville High School District
Elementary:
- Belt Elementary School District
- Centerville Elementary School District
- Cascade Elementary School District
- Great Falls Elementary School District
- Sun River Valley Elementary School District
- Ulm Elementary School District
- Vaughn Elementary School District
There is also a state-operated school, Montana School for the Deaf & Blind.
Communities
City
- Great Falls (county seat)
Towns
Census-designated places
Unincorporated communities
- Adel
- Armington
- Armington Junction
- Ashuelot
- Dearborn (partially within Lewis & Clark County)
- Eden
- Emerson Junction
- Gordon
- Millegan
- Number Seven
- Salem
- Sheffels
- Portage
In popular culture
Several motion pictures have been filmed in Great Falls. Many have filmed in both Cascade County and Great Falls, and a few in just Cascade County (outside the Great Falls city limits). Those films shot in the county and outside Great Falls city limits include:
- Thunderbolt and Lightfoot (1974)
- The Stone Boy (1984)
- The Untouchables (1987)
- Holy Matrimony (1994)
- The Slaughter Rule (2002)
- Northfork (2003)
- Iron Ridge (2008)
- Wildlife (2018)