Burton (UK Parliament constituency)
| Burton | |
|---|---|
|
County constituency for the House of Commons | |
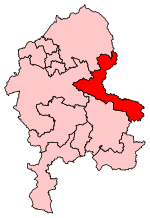 Boundary of Burton in Staffordshire
| |
 Location of Staffordshire within England
| |
| County | Staffordshire |
| Population | 102,731 (2011 census) |
| Electorate | 75,302 (December 2010) |
| Major settlements | Burton upon Trent and Uttoxeter |
| Current constituency | |
| Created | 1885 |
| Member of Parliament | Kate Kniveton (Conservative) |
| Seats | One |
| Created from | East Staffordshire and North Staffordshire |
Burton is a constituency represented in the House of Commons of the Parliament of the United Kingdom. It elects one Member of Parliament (MP) by the first past the post system of election.
Under the 2023 Periodic Review of Westminster constituencies, the constituency will be unchanged, but is to be renamed Burton and Uttoxeter - to be first contested at the next general election.
History
The constituency was created in 1885 replacing the previous East Staffordshire and North Staffordshire constituencies. Burton upon Trent is a centre of the brewing industry and for sixty years from 1885 to 1945, the MPs were from brewery-owning families. Despite the working class nature of Burton upon Trent from 1950 to 1997, the seat was held by the Conservative Party, albeit often with relatively small majorities. Traditionally the brewing industry has been a strong supporter of the Conservative Party. However, like many traditionally Conservative seats, it was lost to the Labour Party at the 1997 general election, which they won in a landslide. Janet Dean retained the seat until 2010, when the Conservatives retook it.
Boundaries
This constituency covers most of the East Staffordshire district. The main town is Burton upon Trent, while it also includes Uttoxeter, Tutbury and Rocester. The remaining small part of East Staffordshire, the area around Abbots Bromley and Yoxall, and, from the 2010 general election (following a review by the Boundary Commission for England), the Needwood ward (containing the village of Barton-under-Needwood), is in the Lichfield constituency.
Members of Parliament
Elections
Elections in the 2010s
| Party | Candidate | Votes | % | ±% | |
|---|---|---|---|---|---|
| Conservative | Kate Griffiths | 29,560 | 60.7 |
|
|
| Labour | Louise Walker | 15,064 | 30.9 |
|
|
| Liberal Democrats | Adam Wain | 2,681 | 5.5 |
|
|
| Green | Kate Copeland | 1,433 | 2.9 |
|
|
| Majority | 14,496 | 29.8 |
|
||
| Turnout | 48,738 | 65.0 |
|
||
| Conservative hold | Swing |
|
|||
| Party | Candidate | Votes | % | ±% | |
|---|---|---|---|---|---|
| Conservative | Andrew Griffiths | 28,936 | 58.0 |
|
|
| Labour | John McKiernan | 18,889 | 37.8 |
|
|
| Liberal Democrats | Dominic Hardwick | 1,262 | 2.5 |
|
|
| Green | Simon Hales | 824 | 1.7 |
|
|
| Majority | 10,047 | 20.2 |
|
||
| Turnout | 49,911 | 67.5 |
|
||
| Conservative hold | Swing |
|
|||
| Party | Candidate | Votes | % | ±% | |
|---|---|---|---|---|---|
| Conservative | Andrew Griffiths | 24,376 | 49.8 |
|
|
| Labour | Jon Wheale | 13,484 | 27.3 |
|
|
| UKIP | Mike Green | 8,658 | 17.5 |
|
|
| Liberal Democrats | David MacDonald | 1,232 | 2.5 |
|
|
| Green | Samantha Patrone | 1,224 | 2.5 | New | |
| Majority | 11,252 | 22.5 |
|
||
| Turnout | 49,334 | 65.5 |
|
||
| Conservative hold | Swing |
|
|||
| Party | Candidate | Votes | % | ±% | |
|---|---|---|---|---|---|
| Conservative | Andrew Griffiths | 22,188 | 44.5 |
|
|
| Labour | Ruth Smeeth | 15,884 | 31.9 |
|
|
| Liberal Democrats | Michael Rodgers | 7,891 | 15.8 |
|
|
| BNP | Alan Hewitt | 2,409 | 4.8 |
|
|
| UKIP | Philip Lancaster | 1,451 | 2.9 |
|
|
| Majority | 6,304 | 12.6 | N/A | ||
| Turnout | 49,823 | 66.5 |
|
||
| Conservative gain from Labour | Swing |
|
|||
Elections in the 2000s
| Party | Candidate | Votes | % | ±% | |
|---|---|---|---|---|---|
| Labour | Janet Dean | 19,701 | 41.1 |
|
|
| Conservative | Adrian Pepper | 18,280 | 38.2 |
|
|
| Liberal Democrats | Sandra Johnson | 6,236 | 13.0 |
|
|
| BNP | Julie Russell | 1,840 | 3.8 | New | |
| UKIP | Philip Lancaster | 913 | 1.9 |
|
|
| Veritas | Brian Buxton | 912 | 1.9 | New | |
| Majority | 1,421 | 2.9 |
|
||
| Turnout | 47,882 | 61.0 |
|
||
| Labour hold | Swing | ||||
| Party | Candidate | Votes | % | ±% | |
|---|---|---|---|---|---|
| Labour | Janet Dean | 22,783 | 49.0 |
|
|
| Conservative | Maggie A. Punyer | 17,934 | 38.6 |
|
|
| Liberal Democrats | David A. Fletcher | 4,468 | 9.6 |
|
|
| UKIP | Ian E. Crompton | 984 | 2.1 | New | |
| ProLife Alliance | John D.W. Roberts | 288 | 0.6 | New | |
| Majority | 4,849 | 10.4 |
|
||
| Turnout | 46,457 | 61.7 |
|
||
| Labour hold | Swing | ||||
Elections in the 1990s
| Party | Candidate | Votes | % | ±% | |
|---|---|---|---|---|---|
| Labour | Janet Dean | 27,810 | 51.0 |
|
|
| Conservative | Ivan Lawrence | 21,480 | 39.4 |
|
|
| Liberal Democrats | David A. Fletcher | 4,617 | 8.5 |
|
|
| National Democrats | Keith Sharp | 604 | 1.1 | New | |
| Majority | 6,330 | 11.6 | N/A | ||
| Turnout | 54,514 | 75.1 |
|
||
| Labour gain from Conservative | Swing |
|
|||
| Party | Candidate | Votes | % | ±% | |
|---|---|---|---|---|---|
| Conservative | Ivan Lawrence | 30,845 | 49.7 |
|
|
| Labour | Patricia K. Muddyman | 24,849 | 40.0 |
|
|
| Liberal Democrats | Rob C. Renold | 6,375 | 10.3 |
|
|
| Majority | 5,996 | 9.7 |
|
||
| Turnout | 62,069 | 82.4 |
|
||
| Conservative hold | Swing |
|
|||
Elections in the 1980s
| Party | Candidate | Votes | % | ±% | |
|---|---|---|---|---|---|
| Conservative | Ivan Lawrence | 29,160 | 50.7 |
|
|
| Labour | Dennis Heptonstall | 19,330 | 33.6 |
|
|
| Liberal | Kenneth Hemsley | 9,046 | 15.7 |
|
|
| Majority | 9,830 | 17.1 |
|
||
| Turnout | 57,536 | 78.6 |
|
||
| Conservative hold | Swing |
|
|||
| Party | Candidate | Votes | % | ±% | |
|---|---|---|---|---|---|
| Conservative | Ivan Lawrence | 27,874 | 51.1 |
|
|
| Labour | Robert Slater | 16,227 | 29.8 |
|
|
| Liberal | June Garner | 10,420 | 19.1 |
|
|
| Majority | 11,647 | 21.3 |
|
||
| Turnout | 54,521 | 75.9 |
|
||
| Conservative hold | Swing |
|
|||
Elections in the 1970s
| Party | Candidate | Votes | % | ±% | |
|---|---|---|---|---|---|
| Conservative | Ivan Lawrence | 29,821 | 54.00 | ||
| Labour | GS Jones | 20,020 | 36.25 | ||
| Liberal | K Stevens | 5,383 | 9.75 | ||
| Majority | 9,801 | 17.75 | |||
| Turnout | 55,224 | 78.75 | |||
| Conservative hold | Swing | ||||
| Party | Candidate | Votes | % | ±% | |
|---|---|---|---|---|---|
| Conservative | Ivan Lawrence | 23,496 | 44.45 | ||
| Labour | David Hill | 21,398 | 40.48 | ||
| Liberal | K Stevens | 7,969 | 15.07 | New | |
| Majority | 2,098 | 3.97 | |||
| Turnout | 52,863 | 77.97 | |||
| Conservative hold | Swing | ||||
| Party | Candidate | Votes | % | ±% | |
|---|---|---|---|---|---|
| Conservative | Ivan Lawrence | 28,343 | 53.09 | ||
| Labour | David Hill | 25,040 | 46.91 | ||
| Majority | 3,303 | 6.18 | |||
| Turnout | 58,383 | 79.48 | |||
| Conservative hold | Swing | ||||
| Party | Candidate | Votes | % | ±% | |
|---|---|---|---|---|---|
| Conservative | John Jennings | 27,428 | 54.32 | ||
| Labour | Ronald G Truman | 23,063 | 45.68 | ||
| Majority | 4,365 | 8.64 | |||
| Turnout | 50,491 | 75.60 | |||
| Conservative hold | Swing | ||||
Elections in the 1960s
| Party | Candidate | Votes | % | ±% | |
|---|---|---|---|---|---|
| Conservative | John Jennings | 23,773 | 50.29 | ||
| Labour | Charles William Shepherd | 23,496 | 49.71 | ||
| Majority | 277 | 0.58 | |||
| Turnout | 47,269 | 78.74 | |||
| Conservative hold | Swing | ||||
| Party | Candidate | Votes | % | ±% | |
|---|---|---|---|---|---|
| Conservative | John Jennings | 25,236 | 53.24 | ||
| Labour | Thomas S Pritchard | 22,161 | 46.76 | ||
| Majority | 3,075 | 6.48 | |||
| Turnout | 47,397 | 80.22 | |||
| Conservative hold | Swing | ||||
Elections in the 1950s
| Party | Candidate | Votes | % | ±% | |
|---|---|---|---|---|---|
| Conservative | John Jennings | 26,926 | 56.14 | ||
| Labour | Edward McGarry | 21,032 | 43.86 | ||
| Majority | 5,894 | 12.28 | |||
| Turnout | 47,958 | 82.36 | |||
| Conservative hold | Swing | ||||
| Party | Candidate | Votes | % | ±% | |
|---|---|---|---|---|---|
| Conservative | John Jennings | 24,519 | 53.23 | ||
| Labour Co-op | Ewart Taylor | 21,546 | 46.77 | ||
| Majority | 2,973 | 6.46 | |||
| Turnout | 46,065 | 80.78 | |||
| Conservative hold | Swing | ||||
| Party | Candidate | Votes | % | ±% | |
|---|---|---|---|---|---|
| Conservative | Arthur Colegate | 24,884 | 50.75 | ||
| Labour | John Stonehouse | 24,151 | 49.25 | ||
| Majority | 733 | 1.50 | |||
| Turnout | 49,035 | 86.31 | |||
| Conservative hold | Swing | ||||
| Party | Candidate | Votes | % | ±% | |
|---|---|---|---|---|---|
| Conservative | Arthur Colegate | 24,903 | 51.54 | ||
| Labour | Arthur W. Lyne | 23,418 | 48.46 | ||
| Majority | 1,485 | 3.08 | N/A | ||
| Turnout | 48,321 | 86.05 | |||
| Conservative gain from Labour | Swing | ||||
Election in the 1940s
| Party | Candidate | Votes | % | ±% | |
|---|---|---|---|---|---|
| Labour | Arthur W. Lyne | 18,288 | 51.06 | ||
| Conservative | John Gretton | 17,528 | 48.94 | ||
| Majority | 760 | 2.12 | N/A | ||
| Turnout | 35,816 | 66.84 | |||
| Labour gain from Conservative | Swing | ||||
Elections in the 1930s
| Party | Candidate | Votes | % | ±% | |
|---|---|---|---|---|---|
| Conservative | John Gretton | 23,539 | 74.54 | ||
| Labour | Gladys Nellie Paling | 8,041 | 25.46 | ||
| Majority | 15,498 | 49.08 | |||
| Turnout | 31,580 | 65.64 | |||
| Conservative hold | Swing | ||||
| Party | Candidate | Votes | % | ±% | |
|---|---|---|---|---|---|
| Conservative | John Gretton | 26,117 | 74.73 | ||
| Labour | William Paling | 8,832 | 25.27 | ||
| Majority | 17,285 | 49.46 | |||
| Turnout | 34,949 | 74.65 | |||
| Conservative hold | Swing | ||||
Elections in the 1920s
| Party | Candidate | Votes | % | ±% | |
|---|---|---|---|---|---|
| Unionist | John Gretton | 18,243 | 52.6 | −21.6 | |
| Labour | William Paling | 10,511 | 30.3 | +4.5 | |
| Liberal | Ifor Bowen Lloyd | 5,943 | 17.1 | New | |
| Majority | 7,732 | 22.3 | −26.1 | ||
| Turnout | 34,697 | 75.3 | −2.5 | ||
| Registered electors | 46,099 | ||||
| Unionist hold | Swing | −13.1 | |||
| Party | Candidate | Votes | % | ±% | |
|---|---|---|---|---|---|
| Unionist | John Gretton | 20,550 | 74.2 | N/A | |
| Labour | F. Thoresby | 7,141 | 25.8 | New | |
| Majority | 13,409 | 48.4 | N/A | ||
| Turnout | 27,691 | 77.8 | N/A | ||
| Registered electors | 35,599 | ||||
| Unionist hold | Swing | N/A | |||
| Party | Candidate | Votes | % | ±% | |
|---|---|---|---|---|---|
| Unionist | John Gretton | Unopposed | |||
| Unionist hold | |||||
| Party | Candidate | Votes | % | ±% | |
|---|---|---|---|---|---|
| Unionist | John Gretton | Unopposed | |||
| Unionist hold | |||||
Election results 1885–1918
Elections in the 1910s
| Party | Candidate | Votes | % | ±% | |
|---|---|---|---|---|---|
| C | Unionist | John Gretton | Unopposed | ||
| Unionist hold | |||||
| C indicates candidate endorsed by the coalition government. | |||||
General Election 1914–15: Another General Election was required to take place before the end of 1915. The political parties had been making preparations for an election to take place and by July 1914, the following candidates had been selected;
- Unionist: Robert Ratcliff
- Liberal:
| Party | Candidate | Votes | % | ±% | |
|---|---|---|---|---|---|
| Liberal Unionist | Robert Ratcliff | 5,877 | 60.8 | N/A | |
| Liberal | Harold Rylett | 3,784 | 39.2 | New | |
| Majority | 2,093 | 21.6 | N/A | ||
| Turnout | 9,661 | 81.3 | N/A | ||
| Registered electors | 11,878 | ||||
| Liberal Unionist hold | Swing | N/A | |||
| Party | Candidate | Votes | % | ±% | |
|---|---|---|---|---|---|
| Liberal Unionist | Robert Ratcliff | Unopposed | |||
| Liberal Unionist hold | |||||
Elections in the 1900s
| Party | Candidate | Votes | % | ±% | |
|---|---|---|---|---|---|
| Liberal Unionist | Robert Ratcliff | 5,613 | 55.1 | −6.9 | |
| Liberal | Francis Vane | 4,572 | 44.9 | +6.9 | |
| Majority | 1,041 | 10.2 | −13.8 | ||
| Turnout | 10,185 | 88.8 | +5.7 | ||
| Registered electors | 11,465 | ||||
| Liberal Unionist hold | Swing | −6.9 | |||
| Party | Candidate | Votes | % | ±% | |
|---|---|---|---|---|---|
| Liberal Unionist | Robert Ratcliff | 5,592 | 62.0 | New | |
| Liberal | Jabez Edward Johnson-Ferguson | 3,421 | 38.0 | N/A | |
| Majority | 2,171 | 24.0 | N/A | ||
| Turnout | 9,013 | 83.1 | N/A | ||
| Registered electors | 10,852 | ||||
| Liberal Unionist gain from Liberal | Swing | N/A | |||
Elections in the 1890s

| Party | Candidate | Votes | % | ±% | |
|---|---|---|---|---|---|
| Liberal | Sydney Evershed | Unopposed | |||
| Liberal hold | |||||
| Party | Candidate | Votes | % | ±% | |
|---|---|---|---|---|---|
| Liberal | Sydney Evershed | Unopposed | |||
| Liberal hold | |||||
Elections in the 1880s
| Party | Candidate | Votes | % | ±% | |
|---|---|---|---|---|---|
| Liberal | Sydney Evershed | 4,792 | 67.4 | N/A | |
| Conservative | Gerald Holbech Hardy | 2,319 | 32.6 | New | |
| Majority | 2,473 | 34.8 | N/A | ||
| Turnout | 7,111 | 75.1 | N/A | ||
| Registered electors | 9,463 | ||||
| Liberal hold | Swing | N/A | |||
- Caused by Bass' elevation to the peerage, becoming Lord Burton.

| Party | Candidate | Votes | % | ±% | |
|---|---|---|---|---|---|
| Liberal | Michael Bass | Unopposed | |||
| Liberal hold | |||||
| Party | Candidate | Votes | % | ±% | |
|---|---|---|---|---|---|
| Liberal | Michael Bass | 5,395 | 68.0 | ||
| Conservative | Gerald Holbech Hardy | 2,543 | 32.0 | ||
| Majority | 2,852 | 36.0 | |||
| Turnout | 7,938 | 83.9 | |||
| Registered electors | 9,463 | ||||
| Liberal win (new seat) | |||||