2018 United States House of Representatives elections in Texas
|
| ||||||||||||||||||||||||||||
| ||||||||||||||||||||||||||||
|
All 36 Texas seats to the United States House of Representatives | ||||||||||||||||||||||||||||
|---|---|---|---|---|---|---|---|---|---|---|---|---|---|---|---|---|---|---|---|---|---|---|---|---|---|---|---|---|
| Turnout | 52.8% | |||||||||||||||||||||||||||
| ||||||||||||||||||||||||||||

| ||||||||||||||||||||||||||||
The 2018 United States House of Representatives elections in Texas were held on Tuesday, November 6, 2018. Voters elected the 36 U.S. representatives from the state of Texas, one from each of the state's 36 congressional districts. The elections coincided with the elections of other offices, including the gubernatorial election, as well as other elections to the House of Representatives, elections to the United States Senate and various state and local elections. The primaries were held on March 6 and the run-offs were held on May 22.
In 2018, for the first time in at least 25 years, the Texas Democratic Party fielded at least one candidate in each of the state's 36 congressional districts. The state congressional delegation changed from a 25–11 Republican majority to a 23–13 Republican majority, the most seats that Democrats had won in the state since 2006. Democrats won almost 47% of the vote, likely due to the down-ballot effect of Representative Beto O'Rourke's Senate candidacy, in which he won 48.3% of the vote, but also because four Democrat incumbents faced no Republican opposition in their general elections.
Turnout was also more than doubled from the last midterm election.
Overview
Statewide
| Party | Candidates | Votes | Seats | ||||
|---|---|---|---|---|---|---|---|
| No. | % | No. | +/– | % | |||
| Republican | 32 | 4,135,359 | 50.41% | 23 |
|
63.9% | |
| Democratic | 36 | 3,852,752 | 46.97% | 13 |
|
36.1% | |
| Libertarian | 31 | 190,816 | 2.33% | 0 | 0.0% | ||
| Independent | 6 | 23,352 | 0.28% | 0 | 0.0% | ||
| Write-in | 4 | 429 | 0.0% | 0 | 0.00% | ||
| Total | 109 | 8,202,708 | 100.0% | 36 | 100.0% | ||
District
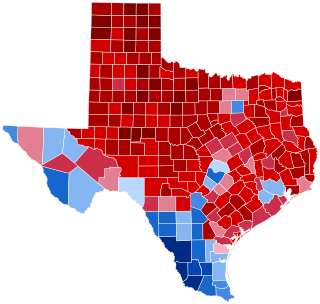
Results of the 2018 United States House of Representatives elections in Texas by district:
| District | Republican | Democratic | Others | Total | Result | ||||
|---|---|---|---|---|---|---|---|---|---|
| Votes | % | Votes | % | Votes | % | Votes | % | ||
| District 1 | 168,165 | 72.26% | 61,263 | 26.32% | 3,292 | 1.41% | 232,720 | 100.0% | Republican hold |
| District 2 | 139,188 | 52.84% | 119,992 | 45.56% | 4,212 | 1.60% | 263,392 | 100.0% | Republican hold |
| District 3 | 169,520 | 54.27% | 138,234 | 44.25% | 4,604 | 1.47% | 312,358 | 100.0% | Republican hold |
| District 4 | 188,667 | 75.70% | 57,400 | 23.03% | 3,178 | 1.28% | 249,245 | 100.0% | Republican hold |
| District 5 | 130,617 | 62.34% | 78,666 | 37.55% | 224 | 0.11% | 209,507 | 100.0% | Republican hold |
| District 6 | 135,961 | 53.10% | 116,350 | 45.44% | 3,731 | 1.46% | 256,042 | 100.0% | Republican hold |
| District 7 | 115,642 | 47.47% | 127,959 | 52.53% | 0 | 0.00% | 243,601 | 100.0% | Democratic gain |
| District 8 | 200,619 | 73.44% | 67,930 | 24.87% | 4,621 | 1.69% | 273,170 | 100.0% | Republican hold |
| District 9 | 0 | 0.00% | 136,256 | 89.06% | 16,745 | 10.94% | 153,001 | 100.0% | Democratic hold |
| District 10 | 157,166 | 51.06% | 144,034 | 46.79% | 6,627 | 2.15% | 307,827 | 100.0% | Republican hold |
| District 11 | 176,603 | 80.14% | 40,631 | 18.44% | 3,143 | 1.43% | 220,377 | 100.0% | Republican hold |
| District 12 | 172,557 | 64.27% | 90,994 | 33.89% | 4,940 | 1.84% | 268,491 | 100.0% | Republican hold |
| District 13 | 169,027 | 81.54% | 35,083 | 16.93% | 3,175 | 1.53% | 207,285 | 100.0% | Republican hold |
| District 14 | 138,942 | 59.24% | 92,212 | 39.32% | 3,374 | 1.44% | 234,528 | 100.0% | Republican hold |
| District 15 | 63,862 | 38.75% | 98,333 | 59.67% | 2,607 | 1.58% | 164,802 | 100.0% | Democratic hold |
| District 16 | 49,127 | 27.03% | 124,437 | 68.46% | 8,190 | 4.51% | 181,754 | 100.0% | Democratic hold |
| District 17 | 134,841 | 56.81% | 98,070 | 41.32% | 4,440 | 1.87% | 237,351 | 100.0% | Republican hold |
| District 18 | 38,368 | 20.81% | 138,704 | 75.25% | 7,260 | 3.94% | 184,332 | 100.0% | Democratic hold |
| District 19 | 151,946 | 75.23% | 50,039 | 24.77% | 0 | 0.00% | 201,985 | 100.0% | Republican hold |
| District 20 | 0 | 0.00% | 139,038 | 80.85% | 32,925 | 19.15% | 171,963 | 100.0% | Democratic hold |
| District 21 | 177,654 | 50.24% | 168,421 | 47.63% | 7,542 | 2.13% | 353,617 | 100.0% | Republican hold |
| District 22 | 152,750 | 51.36% | 138,153 | 46.45% | 6,502 | 2.19% | 297,405 | 100.0% | Republican hold |
| District 23 | 103,285 | 49.17% | 102,359 | 48.73% | 4,425 | 2.11% | 210,069 | 100.0% | Republican hold |
| District 24 | 133,317 | 50.61% | 125,231 | 47.54% | 4,870 | 1.85% | 263,418 | 100.0% | Republican hold |
| District 25 | 163,023 | 53.53% | 136,385 | 44.78% | 5,145 | 1.69% | 304,553 | 100.0% | Republican hold |
| District 26 | 185,551 | 59.38% | 121,938 | 39.02% | 5,016 | 1.61% | 312,505 | 100.0% | Republican hold |
| District 27 | 125,118 | 60.32% | 75,929 | 36.61% | 6,374 | 3.07% | 207,421 | 100.0% | Republican hold |
| District 28 | 0 | 0.00% | 117,494 | 84.39% | 21,732 | 15.61% | 139,226 | 100.0% | Democratic hold |
| District 29 | 28,098 | 23.91% | 88,188 | 75.06% | 1,208 | 1.03% | 117,494 | 100.0% | Democratic hold |
| District 30 | 0 | 0.00% | 166,784 | 91.05% | 16,390 | 8.95% | 183,174 | 100.0% | Democratic hold |
| District 31 | 144,680 | 50.59% | 136,362 | 47.68% | 4,965 | 1.74% | 286,007 | 100.0% | Republican hold |
| District 32 | 126,101 | 45.75% | 144,067 | 52.27% | 5,452 | 1.98% | 275,620 | 100.0% | Democratic gain |
| District 33 | 26,120 | 21.91% | 90,805 | 76.16% | 2,299 | 1.93% | 119,224 | 100.0% | Democratic hold |
| District 34 | 57,243 | 40.01% | 85,825 | 59.99% | 0 | 0.00% | 143,068 | 100.0% | Democratic hold |
| District 35 | 50,553 | 26.05% | 138,278 | 71.25% | 5,236 | 2.70% | 194,067 | 100.0% | Democratic hold |
| District 36 | 161,048 | 72.56% | 60,908 | 27.44% | 0 | 0.00% | 221,956 | 100.0% | Republican hold |
| Total | 4,135,359 | 50.41% | 3,852,752 | 46.97% | 214,597 | 2.62% | 8,202,708 | 100.0% | |
District 1
|
| |||||||||||||||||
| |||||||||||||||||
| |||||||||||||||||


The first district is located in East Texas, including Deep East Texas, and takes in Longview, Lufkin, and Tyler. Incumbent Republican Louie Gohmert, who had represented the district since 2005, ran for re-election. He was re-elected with 73.9% of the vote in 2016. The district had a PVI of R+25.
Republican primary
Candidates
Nominee
- Louie Gohmert, incumbent U.S. Representative
Declined
- Anthony Culler
- Roshin Rowjee, physician
Results
| Party | Candidate | Votes | % | |
|---|---|---|---|---|
| Republican | Louie Gohmert (incumbent) | 64,004 | 88.3 | |
| Republican | Anthony Culler | 6,504 | 9.0 | |
| Republican | Roshin Rowjee | 1,955 | 2.7 | |
| Total votes | 72,463 | 100 | ||
Democratic primary
Candidates
Nominee
- Shirley McKellar, Army veteran, non-profit businesswoman and nominee for this seat in 2012, 2014 & 2016
Eliminated in primary
- Brent Beal, professor
Results
| Party | Candidate | Votes | % | |
|---|---|---|---|---|
| Democratic | Shirley McKellar | 9,181 | 61.0 | |
| Democratic | Brent Beal | 5,858 | 39.0 | |
| Total votes | 15,039 | 100 | ||
Libertarian primary
Candidates
Nominee
- Jeff Callaway, Texas Outlaw Poet
General election
Endorsements
- Organizations
- Labor unions
Results
| Party | Candidate | Votes | % | |
|---|---|---|---|---|
| Republican | Louie Gohmert (incumbent) | 168,165 | 72.3 | |
| Democratic | Shirley McKellar | 61,263 | 26.3 | |
| Libertarian | Jeff Callaway | 3,292 | 1.4 | |
| Total votes | 232,720 | 100 | ||
| Republican hold | ||||
District 2
|
| |||||||||||||||||
| |||||||||||||||||
 County results
Crenshaw: 50–60% | |||||||||||||||||
| |||||||||||||||||

This district is located in Greater Houston, including parts of northern and western Houston, as well as Humble, Kingwood, and Spring. Incumbent Republican Ted Poe, who had represented the district since 2005, did not run for re-election. He was re-elected with 60.6% of the vote in 2016. The district had a PVI of R+11.
Republican primary
Candidates
Nominee
- Dan Crenshaw, retired U.S. Navy Lieutenant commander and former Navy SEAL
Eliminated in primary
- David Balat, healthcare executive
- Johnny Havens, attorney and retired U.S. Army Captain
- Justin Lurie, investment banker
- Kevin Roberts, state representative
- Jon Spiers, surgeon
- Rick Walker, businessman and retired U.S. Army Reserve Captain
- Kathaleen Wall, activist and fundraiser
- Malcolm Whittaker, patent lawyer
Declined
- Ted Poe, incumbent U.S. Representative
Endorsements
- U.S. Representatives
- Mary Bono, Representative for California's 45th congressional district (1998–2013)
- Pete Sessions, Representative for Texas's 32nd congressional district (1993–present)
- Scott Taylor, Representative for Virginia's 2nd congressional district (2017–present)
- Organizations
- Individuals
- Buzz Aldrin, retired astronaut
- Hugh Hewitt, conservative radio talk show host, attorney, academic and author
- State legislators
- Labor unions
- Organizations
- Newspapers
- U.S. Senators
- Ted Cruz, Senator (R-TX)
- U.S. Representatives
- Cathy McMorris Rodgers, Representative for Washington's 5th congressional district (2005–present)
- Randy Weber, Representative for Texas's 14th congressional district (2013–present)
- State officials
- State legislators
- Joan Huffman, state senator
- Organizations
- Susan B. Anthony List
- Texas Right to Life
Results
| Party | Candidate | Votes | % | |
|---|---|---|---|---|
| Republican | Kevin Roberts | 15,236 | 33.0 | |
| Republican | Dan Crenshaw | 12,644 | 27.4 | |
| Republican | Kathaleen Wall | 12,499 | 27.1 | |
| Republican | Rick Walker | 3,315 | 7.2 | |
| Republican | Johnny Havens | 934 | 2.0 | |
| Republican | Justin Lurie | 425 | 0.9 | |
| Republican | Jon Spiers | 417 | 0.9 | |
| Republican | David Balat | 348 | 0.8 | |
| Republican | Malcolm Whittaker | 322 | 0.7 | |
| Total votes | 46,140 | 100 | ||
Runoff results
| Party | Candidate | Votes | % | |
|---|---|---|---|---|
| Republican | Dan Crenshaw | 20,322 | 69.9 | |
| Republican | Kevin Roberts | 8,760 | 30.1 | |
| Total votes | 29,082 | 100 | ||
Democratic primary
Candidates
Nominee
- Todd Litton, former chair of the City of Houston's Tower Commission
Eliminated in primary
- Darnell Jones, retired U.S. Navy Lieutenant commander
- Ali Khorasani, field service engineer
- Silky Malik, author
- H.P. Parvizian, franchise owner
Endorsements
- Organizations
- Organizations
Results
| Party | Candidate | Votes | % | |
|---|---|---|---|---|
| Democratic | Todd Litton | 15,113 | 52.8 | |
| Democratic | Darnell Jones | 6,308 | 22.1 | |
| Democratic | Silky Malik | 2,770 | 9.7 | |
| Democratic | H. P. Parvizian | 2,259 | 7.9 | |
| Democratic | Ali Khorasani | 2,148 | 7.5 | |
| Total votes | 28,598 | 100 | ||
Libertarian primary
Candidates
Nominee
- Patrick Gunnels
Eliminated in primary
- James Kong
General election
Endorsements
- U.S. Representatives
- Mary Bono, Representative for California's 45th congressional district (1998–2013)
- Pete Sessions, Representative for Texas's 32nd congressional district (1993–present)
- Scott Taylor, Representative for Virginia's 2nd congressional district (2017–present)
- Organizations
- Individuals
- Buzz Aldrin, retired astronaut
- Hugh Hewitt, conservative radio talk show host, attorney, academic and author
- Labor unions
- Organizations
- Democratic Congressional Campaign Committee "Red to Blue" Program
- End Citizens United
- Newspapers
Polling
| Poll source | Date(s) administered |
Sample size |
Margin of error |
Dan Crenshaw (R) |
Todd Litton (D) |
Undecided |
|---|---|---|---|---|---|---|
| TargetPoint (R) | October 14–16, 2018 | 435 | – | 49% | 40% | 11% |
Predictions
| Source | Ranking | As of |
|---|---|---|
| The Cook Political Report | Likely R | November 5, 2018 |
| Inside Elections | Safe R | November 5, 2018 |
| Sabato's Crystal Ball | Likely R | November 5, 2018 |
| RCP | Safe R | November 5, 2018 |
| Daily Kos | Likely R | November 5, 2018 |
| 538 | Likely R | November 7, 2018 |
| CNN | Safe R | October 31, 2018 |
| Politico | Likely R | November 4, 2018 |
Results
| Party | Candidate | Votes | % | |
|---|---|---|---|---|
| Republican | Dan Crenshaw | 139,188 | 52.8 | |
| Democratic | Todd Litton | 119,992 | 45.6 | |
| Libertarian | Patrick Gunnels | 2,373 | 0.9 | |
| Independent | Scott Cubbler | 1,839 | 0.7 | |
| Total votes | 263,392 | 100.0 | ||
| Republican hold | ||||
District 3
|
| |||||||||||||||||
| |||||||||||||||||
| |||||||||||||||||

The 3rd district is located in the Dallas–Fort Worth metroplex, including the Dallas suburbs of Frisco, McKinney, and Plano. Incumbent Republican Sam Johnson, who had represented the district since 1991, did not run for re-election. He was re-elected with 61.2% of the vote in 2016. The district had a PVI of R+13.
Republican primary
Candidates
Nominee
- Van Taylor, state senator for the 8th district
Eliminated in primary
- Roger Barone, businessman
- Alex Donkervoet, actuary
Declined
- Sam Johnson, incumbent U.S. Representative
Endorsements
- Newspapers
Results
| Party | Candidate | Votes | % | |
|---|---|---|---|---|
| Republican | Van Taylor | 45,475 | 84.7 | |
| Republican | David Niederkorn | 5,052 | 9.4 | |
| Republican | Alex Donkervoet | 3,185 | 5.9 | |
| Total votes | 53,712 | 100 | ||
Democratic primary
Candidates
Nominee
- Lorie Burch, LGBT rights attorney
Eliminated in primary
- Adam Bell, businessman and nominee for this seat in 2016
- Sam Johnson, attorney
- Medrick Yhap, mortgage consultant
Endorsements
Results
| Party | Candidate | Votes | % | |
|---|---|---|---|---|
| Democratic | Lorie Burch | 15,468 | 49.6 | |
| Democratic | Sam Johnson | 8,943 | 28.7 | |
| Democratic | Adam Bell | 5,598 | 17.9 | |
| Democratic | Medrick Yhap | 1,172 | 3.8 | |
| Total votes | 31,181 | 100 | ||
Runoff results
| Party | Candidate | Votes | % | |
|---|---|---|---|---|
| Democratic | Lorie Burch | 9,344 | 75.0 | |
| Democratic | Sam Johnson | 3,107 | 25.0 | |
| Total votes | 12,451 | 100 | ||
Libertarian primary
Candidates
Nominee
- Christopher Claytor
Eliminated in primary
- Scott Jameson
Results
Christopher Claytor was declared the nominee by defeating Scott Jameson at the Collin County Libertarian Party Convention on Saturday, March 17.
Independents
- Roger Barone
- Robert Mason (Humane Party)
General election
Endorsements
- Organizations
Predictions
| Source | Ranking | As of |
|---|---|---|
| The Cook Political Report | Safe R | November 5, 2018 |
| Inside Elections | Safe R | November 5, 2018 |
| Sabato's Crystal Ball | Safe R | November 5, 2018 |
| RCP | Safe R | November 5, 2018 |
| Daily Kos | Safe R | November 5, 2018 |
| 538 | Safe R | November 7, 2018 |
| CNN | Safe R | October 31, 2018 |
| Politico | Likely R | November 4, 2018 |
Results
| Party | Candidate | Votes | % | |
|---|---|---|---|---|
| Republican | Van Taylor | 169,520 | 54.2 | |
| Democratic | Lorie Burch | 138,234 | 44.2 | |
| Libertarian | Christopher Claytor | 4,604 | 1.5 | |
| Independent | Jeff Simons (write-in) | 153 | 0.1 | |
| Total votes | 312,511 | 100 | ||
| Republican hold | ||||