1988 United States Senate elections
|
| |||||||||||||||||||||||||||||||||||||
| |||||||||||||||||||||||||||||||||||||
|
33 of the 100 seats in the United States Senate 51 seats needed for a majority | |||||||||||||||||||||||||||||||||||||
|---|---|---|---|---|---|---|---|---|---|---|---|---|---|---|---|---|---|---|---|---|---|---|---|---|---|---|---|---|---|---|---|---|---|---|---|---|---|
| |||||||||||||||||||||||||||||||||||||
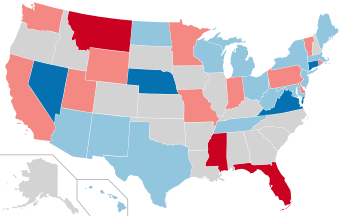
Results of the elections:
Democratic gain Democratic hold Republican gain Republican hold No election | |||||||||||||||||||||||||||||||||||||
| |||||||||||||||||||||||||||||||||||||
The 1988 United States Senate elections were elections for the United States Senate. Held on November 8, the 33 seats of Class 1 were contested in regular elections. In spite of the Republican victory by George H. W. Bush in the presidential election, the Democrats gained a net of one seat in the Senate. Seven seats changed parties, with four incumbents being defeated. The Democratic majority in the Senate increased by one to 55–to–45.
This is the last Senate election cycle in which California voted for a Republican and both Texas and Maine voted for Democrats, and the last time Arizona would do so until 2018. This would also be the last Senate election cycle until 1998 to not have at least one special election during that cycle.
This is also the last Senate election cycle in which no woman was elected to the Senate from either party as all the winners were men.
Results summary
Summary of the 1988 United States Senate election results
| 55 | 45 |
| Democratic | Republican |
| Parties | Total | ||||||||||||||||||||||||||||||||||||||||||||||||||||||||||||||||||||||||||||||||||||||||||||||||||
|---|---|---|---|---|---|---|---|---|---|---|---|---|---|---|---|---|---|---|---|---|---|---|---|---|---|---|---|---|---|---|---|---|---|---|---|---|---|---|---|---|---|---|---|---|---|---|---|---|---|---|---|---|---|---|---|---|---|---|---|---|---|---|---|---|---|---|---|---|---|---|---|---|---|---|---|---|---|---|---|---|---|---|---|---|---|---|---|---|---|---|---|---|---|---|---|---|---|---|---|
| Democratic | Republican | Libertarian | Conservative | Other | |||||||||||||||||||||||||||||||||||||||||||||||||||||||||||||||||||||||||||||||||||||||||||||||
| Last elections (1986) | 55 | 45 | 0 | 0 | 0 | 100 | |||||||||||||||||||||||||||||||||||||||||||||||||||||||||||||||||||||||||||||||||||||||||||||
| Before these elections | 54 | 46 | 0 | 0 | 0 | 100 | |||||||||||||||||||||||||||||||||||||||||||||||||||||||||||||||||||||||||||||||||||||||||||||
| Not up | 36 | 31 | — | — | — | 67 | |||||||||||||||||||||||||||||||||||||||||||||||||||||||||||||||||||||||||||||||||||||||||||||
| Up Class 1 (1982→1988) |
18 | 15 | — | — | — | 33 | |||||||||||||||||||||||||||||||||||||||||||||||||||||||||||||||||||||||||||||||||||||||||||||
| Incumbent retired | 3 | 3 | — | — | — | 6 | |||||||||||||||||||||||||||||||||||||||||||||||||||||||||||||||||||||||||||||||||||||||||||||
| Held by same party | 1 | 2 | — | — | — | 3 | |||||||||||||||||||||||||||||||||||||||||||||||||||||||||||||||||||||||||||||||||||||||||||||
| Replaced by other party |
|
— | — | — | 3 | ||||||||||||||||||||||||||||||||||||||||||||||||||||||||||||||||||||||||||||||||||||||||||||||
| Result | 2 | 4 | — | — | — | 6 | |||||||||||||||||||||||||||||||||||||||||||||||||||||||||||||||||||||||||||||||||||||||||||||
| Incumbent ran | 15 | 12 | — | — | — | 27 | |||||||||||||||||||||||||||||||||||||||||||||||||||||||||||||||||||||||||||||||||||||||||||||
| Won re-election | 14 | 9 | — | — | — | 23 | |||||||||||||||||||||||||||||||||||||||||||||||||||||||||||||||||||||||||||||||||||||||||||||
| Lost re-election |
|
— | — | — | 4 | ||||||||||||||||||||||||||||||||||||||||||||||||||||||||||||||||||||||||||||||||||||||||||||||
|
Lost renomination, but held by same party |
0 | 0 | — | — | — | 0 | |||||||||||||||||||||||||||||||||||||||||||||||||||||||||||||||||||||||||||||||||||||||||||||
| Result | 17 | 10 | — | — | — | 27 | |||||||||||||||||||||||||||||||||||||||||||||||||||||||||||||||||||||||||||||||||||||||||||||
| Total elected | 19 | 14 | — | — | — | 33 | |||||||||||||||||||||||||||||||||||||||||||||||||||||||||||||||||||||||||||||||||||||||||||||
| Net gain/loss |
|
|
|
|
|
1 | |||||||||||||||||||||||||||||||||||||||||||||||||||||||||||||||||||||||||||||||||||||||||||||
| Nationwide vote | 35,137,786 | 31,151,251 | 268,053 | 189,226 | 677,928 | 67,424,244 | |||||||||||||||||||||||||||||||||||||||||||||||||||||||||||||||||||||||||||||||||||||||||||||
| Share | 52.11% | 46.20% | 0.40% | 0.28% | 1.01% | 100% | |||||||||||||||||||||||||||||||||||||||||||||||||||||||||||||||||||||||||||||||||||||||||||||
| Result | 55 | 45 | 0 | 0 | 0 | 100 | |||||||||||||||||||||||||||||||||||||||||||||||||||||||||||||||||||||||||||||||||||||||||||||
Source: Clerk of the United States House of Representatives. "Statistics of the Presidential and Congressional Election of November 8, 1988" (PDF). U.S. Government Printing Office. Retrieved July 2, 2014.
Gains and losses
Retirements
Three Republicans and three Democrats retired instead of seeking re-election.
Defeats
Three Republicans and one Democrat sought re-election but lost in the general election.
| State | Senator | Replaced by |
|---|---|---|
| Connecticut | Lowell Weicker | Joe Lieberman |
| Montana | John Melcher | Conrad Burns |
| Nebraska | David Karnes | Bob Kerrey |
| Nevada | Chic Hecht | Richard Bryan |
Post-election changes
One Republican resigned on January 3, 1989, while one Democrat died on May 16, 1990. Initially, they were replaced by appointees.
| State | Senator | Replaced by |
|---|---|---|
| Hawaii (Class 1) |
Spark Matsunaga | Daniel Akaka |
| Indiana (Class 3) |
Dan Quayle | Dan Coats |